Download presentation
Presentation is loading. Please wait.

1
Spatial Survey Designs for Aquatic Resource Monitoring Anthony (Tony) R. Olsen Western Ecology Division US Environmental Protection Agency Corvallis, Oregon Olsen.Tony@epa.gov http://www.epa.gov/nheerl/arm

2
Short Course Objectives Gain understanding of role spatial survey design process plays in monitoring framework Gain an understanding of importance of developing survey design requirements for a monitoring program Learn to choose a spatial survey design that meets survey design requirements Illustrate selecting sites using R statistical software Show breadth of spatial survey design options available

3
National Water Quality Monitoring Council: Monitoring Framework Applies to all natural resource monitoring Monitoring pieces must be designed and implemented to fit together View as information system National monitoring requires consistent framework Reference: Water Resources IMPACT, September 2003 issue

4
Kish (1965): “The survey objectives should determine the sample design; but the determination is actually a two-way process…” Initially objectives are stated in common sense statements – challenge is to transform them into quantitative questions that can be used to specify the design. Statistical perspective Know whether a monitoring design can answer the question Know when the question is not precise enough – multiple interpretations Develop monitoring objectives Convey Results and findings Design monitoring program

5
Design monitoring program Collect field and lab data Develop monitoring objectives Key components of monitoring design What resource will be monitored? (target population) What will be measured? (variables or indicators) How will indicators be measured? (response design) When and how frequently will the measurements be taken? (temporal design) Where will the measurements be taken? (spatial survey design) Statistical perspective Target population and its representation, the sample frame Spatial survey design for site selection Panel design for monitoring across years
 What will be measured. (variables or indicators) How will indicators be measured. (response design) When and how frequently will the measurements be taken. (temporal design) Where will the measurements be taken. (spatial survey design) Statistical perspective Target population and its representation, the sample frame Spatial survey design for site selection Panel design for monitoring across years.")
6
Spatial Survey Design Process Resource Characteristics Monitoring Objectives Institutional Constraints Design Requirements Target Population Sample Frame Spatial Survey Design Site Selection using R Design File

7
Spatial Survey Design Options and Illustration of Site Selection using R

8
Basic Spatial Survey Designs Simple Random Sample Systematic Sample Regular grid over a geographic region Regular spacing on linear resource Spatially Balanced Sample Characteristics from both simple random and systematic options Guarantees all possible samples are distributed across the sample frame Generalized Random Tessellation Stratified (GRTS) design
 design")
9
Generalized Random Tessellation Stratified (GRTS) Survey Designs Probability sample producing design-based estimators and variance estimators Another option to simple random sample and systematic sample designs Simple random samples tend to “clump” Systematic samples difficult to implement for aquatic resources and do not have design-based variance estimator Emphasize spatial-balance Every replication of the sample exhibits a spatial density pattern that closely mimics the spatial density pattern of the resource
 Survey Designs Probability sample producing design-based estimators and variance estimators Another option to simple random sample and systematic sample designs Simple random samples tend to clump Systematic samples difficult to implement for aquatic resources and do not have design-based variance estimator Emphasize spatial-balance Every replication of the sample exhibits a spatial density pattern that closely mimics the spatial density pattern of the resource")
10
Spatial Balance: 256 points

11
Why aren’t Basic Designs Sufficient? Monitoring objectives may include requirements that basic designs can’t address efficiently Estimates for particular subpopulations requires greater sampling effort Administrative restrictions and operational costs Natural resource in study region makes basic designs inefficient Resource may be known to be restricted to particular subregions Complex designs may be more cost-effective

12
Options to use with GRTS Three sample frame types (shapefile types) Point or finite Linear network Area or polygon Survey Design features Stratification Equal, unequal, or continuous probability of selection Over sample for use when some sites can not be used Panels for surveys over time Two stage survey designs
 Point or finite Linear network Area or polygon Survey Design features Stratification Equal, unequal, or continuous probability of selection Over sample for use when some sites can not be used Panels for surveys over time Two stage survey designs")
13
Specifying Designs in R design1 = list(None=list(panel=c(Panel_1=50), seltype= “Equal”) ) design2 = list(None=list(panel=c(Panel_1=50, Panel_2=50), seltype= “Equal”, over=100) ) design3 = list(Stratum1=list(panel=c(Panel_1=50), seltype= “Equal” over=50) Stratum2=list(panel=c(Panel_1=50), seltype= “Unequal” caty.n=c(category1=25, category2=25) ) )
, seltype= Equal ) ) design2 = list(None=list(panel=c(Panel_1=50, Panel_2=50), seltype= Equal , over=100) ) design3 = list(Stratum1=list(panel=c(Panel_1=50), seltype= Equal over=50) Stratum2=list(panel=c(Panel_1=50), seltype= Unequal caty.n=c(category1=25, category2=25) ) )")
15
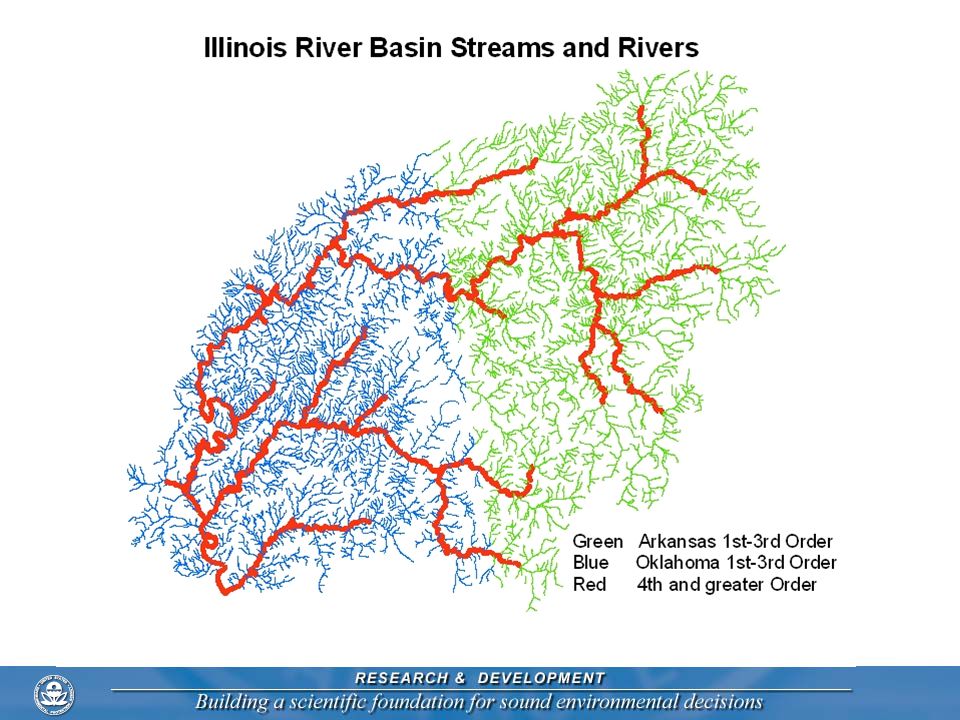
Illinois River Basin GRTS designs for Streams dsgn <- list(None=list(panel=c(Panel_1=100), seltype=“Equal” )) dsgn <- list(Oklahoma=list(panel=c(Panel_1=50), seltype='Unequal', caty.n=c(“1st-3rd"=25, “4th-7th”=25), over=50), Arkansas=list(panel=c(Panel_1=50), seltype='Unequal', caty.n=c (“1st-3rd"=25, “4th-7th”=25), over=50) )
, seltype= Equal )) dsgn <- list(Oklahoma=list(panel=c(Panel_1=50), seltype= Unequal , caty.n=c( 1st-3rd =25, 4th-7th =25), over=50), Arkansas=list(panel=c(Panel_1=50), seltype= Unequal , caty.n=c ( 1st-3rd =25, 4th-7th =25), over=50) )")
16
Illinois River Basin Site Selection using R library(spsurvey) att <- read.dbf('Illinois_ri_ok_ar') sites <- grts(design=dsgn, DesignID="OKI06594", type.frame="linear", in.shape="Illinois_ri_ok_ar", att.frame=att, stratum="STATE_NAME", mdcaty="SO_CAT", prjfilename='Illinois_ri_ok_ar', out.shape="Illinois River Basin Sites")
 att <- read.dbf( Illinois_ri_ok_ar ) sites <- grts(design=dsgn, DesignID= OKI06594 , type.frame= linear , in.shape= Illinois_ri_ok_ar , att.frame=att, stratum= STATE_NAME , mdcaty= SO_CAT , prjfilename= Illinois_ri_ok_ar , out.shape= Illinois River Basin Sites )")
19
Example Design File

20
R and spsurvey library R statistics program and spsurvey library are free Information on where to get them and how to install available at http://www.epa.gov/nheerl/arm under “Download Software” on left hand menuhttp://www.epa.gov/nheerl/arm All commands necessary to create Illinois designs were given on previous slides Example “R scripts” and shapefiles are available on ARM web site Challenges Creating appropriate shapefile for the sample frame Learning basics of R Selecting appropriate spatial survey design

21
Specifying Design Requirements Design requirements impacted by Monitoring objectives Aquatic resource characteristics Target population and subpopulations Sample frame Institutional constraints Iterative process involving professionals with different backgrounds and perspectives Managers (decision makers) Aquatic resource experts (ecologists, biologists, chemists, etc) with monitoring expertise Statistical experts (experience in spatial survey design) GIS specialists
 Aquatic resource experts (ecologists, biologists, chemists, etc) with monitoring expertise Statistical experts (experience in spatial survey design) GIS specialists")
22
Survey Design & Response Design Survey design is process of selecting sites at which a response will be determined Which sites will be visited (spatial component) Which year will sites be visited (temporal component, panel design) Response design is process of obtaining a response at a site: When site is to be visited within a monitoring season A single index period visit during a monitoring season Multiple visits during monitoring season: e.g. monthly, quarterly Field plot design Process of going from basic field measurements to indicators

23
Use examples to illustrate generation of different spatial survey design requirements and selection of spatial survey designs Lakes South Carolina Lakes as area resource National Lake Assessment lakes as point lake resource Streams Illinois River Basin streams as linear stream resource Pennsylvania attaining stream segments as point stream resource Estuaries Puget Sound? Southern California Bight Wetlands Iowa points Ohio area Minnesota wetlands as two-stage design

25
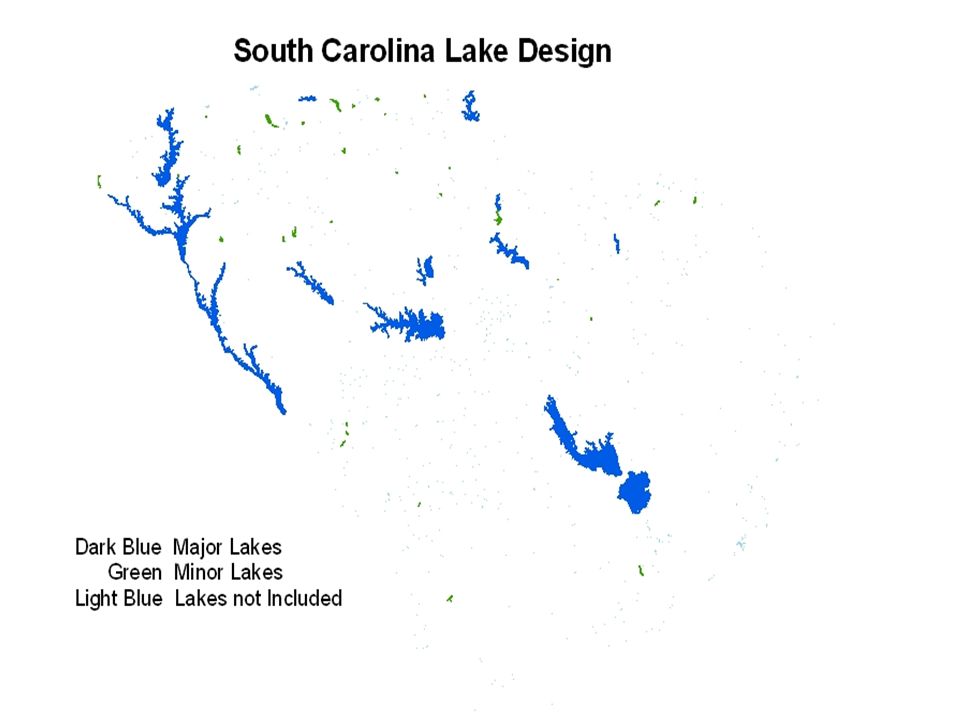
Lake Design: South Carolina Monitoring Objectives Estimate the number of hectares of major and minor lakes in South Carolina that meet water quality criteria (also other indicators) Target Population and Resource Characteristics State identifies 17 major lakes and 35 minor lakes Require estimates for major, minor, and combined lake subpopulations Elements are all possible locations within surface area of identified lakes Sample Frame Shapefile from NHD Attribute that identifies minor, major, and other lakes within state Institutional Constraints Sample size 30 sites per year across target population Complete survey over 5 year period
 Target Population and Resource Characteristics State identifies 17 major lakes and 35 minor lakes Require estimates for major, minor, and combined lake subpopulations Elements are all possible locations within surface area of identified lakes Sample Frame Shapefile from NHD Attribute that identifies minor, major, and other lakes within state Institutional Constraints Sample size 30 sites per year across target population Complete survey over 5 year period")
27
NHD Lakes

28
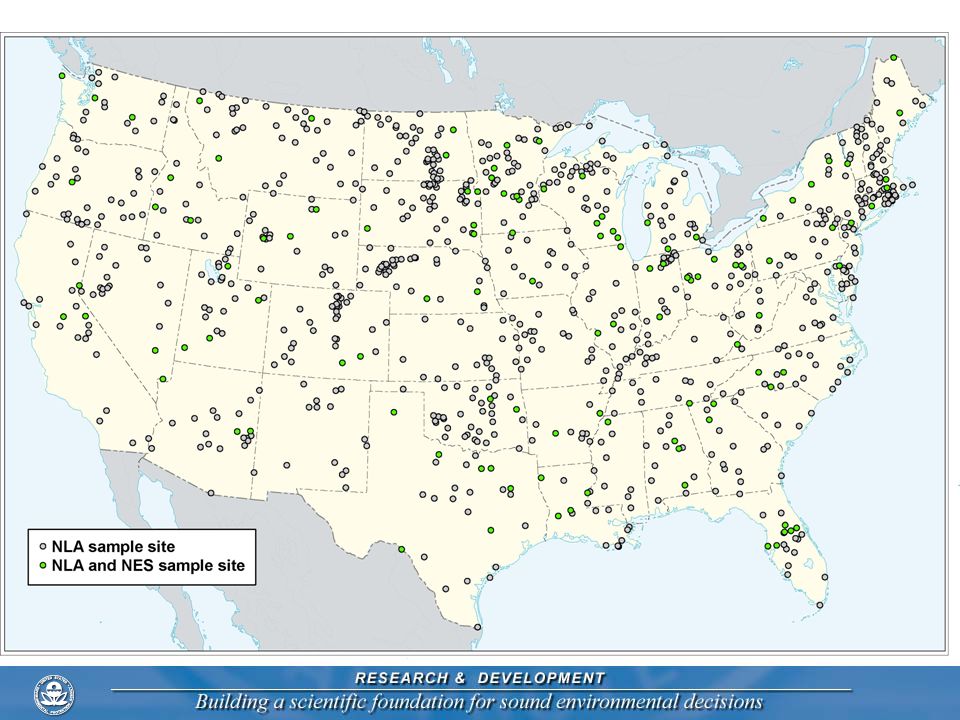
Lake Design: National Lake Assessment Monitoring Objectives Estimate number of lakes in 48 states that are in “good” condition nationally and by 9 aggregated ecoregions Estimate change in eutrophication status for 1972-76 National Eutrophication Study lakes Target Population and Resource Characteristics All lakes/reservoirs/ponds greater than 4 hectares Elements are individual lakes Very skewed lake area size distribution Sample Frame Shapefile based on NHD Attributes for state, lake area category, ecoregion, and NES lake Institutional Constraints Total number of lakes that can be sampled: 1000 States operate independently Survey occur in one year

29
NHD Lake Sample Frame: Points

31
National Lake Survey: Overview Distribution of Lakes in Survey Lake Size Category # of Lakes Selected Total # of Lakes in the US 10-25 acres 10468,559 (4-10 hectares) 25-50 acres 18524,902 (10-20 hectares) 50-125 acres 18416,488 (20-50 hectares) 125-250 acres 1726,134 (50-100 hectares) > 250 acres 2647,356 (>100 hectares) Total909123,439 Total number of lake visits: 1,000 909 unique lakes 91 lakes for repeat sampling Number of Lakes from 1972-76 National Lake Eutrophication Study (NES): 113 Number of Lakes per state: Range: 4-41 Median: 18 Number of lakes per ecoregion: Range: 84-119 Median: 101
 acres 18524,902 (10-20 hectares) acres 18416,488 (20-50 hectares) acres 1726,134 ( hectares) > 250 acres 2647,356 (>100 hectares) Total909123,439 Total number of lake visits: 1, unique lakes 91 lakes for repeat sampling Number of Lakes from National Lake Eutrophication Study (NES): 113 Number of Lakes per state: Range: 4-41 Median: 18 Number of lakes per ecoregion: Range: Median: 101")
34
Stream Design: Pennsylvania Attaining Segments Monitoring Objectives Estimate number of currently attaining stream segments within each basin that remain attaining Target Population and Resource Characteristics All attaining stream segments within each basin in Pennsylvania Elements are stream segments not point on stream linear network Sample Frame Polyline shapefile of stream network and point shapefile of segment centroids Institutional Constraints 30 segments sampled per basin 5 random locations on each of the 30 segments; one of which will be sampled Two-stage spatial survey design Stage 1: select equal probability sample of segments within basin using GRTS for finite/point resource Stage 2: select sites within each segment using GRTS for linear resource

37
Estuary Design: Chesapeake Bay NCA Monitoring Objectives Estimate the square kilometers of Chesapeake Bay and 10 subregions that are in “good” condition Target Population and Resource Characteristics Surface area of Chesapeake Bay estuary Elements are all locations Subpopulations are 10 subregions Sample Frame NCA generated polygon shapefile Attribute for subregions Institutional Constraints 125 sites sampled in 2005 and 2006 Spatial survey design for an areal resource with unequal probability for 10 subregions

41
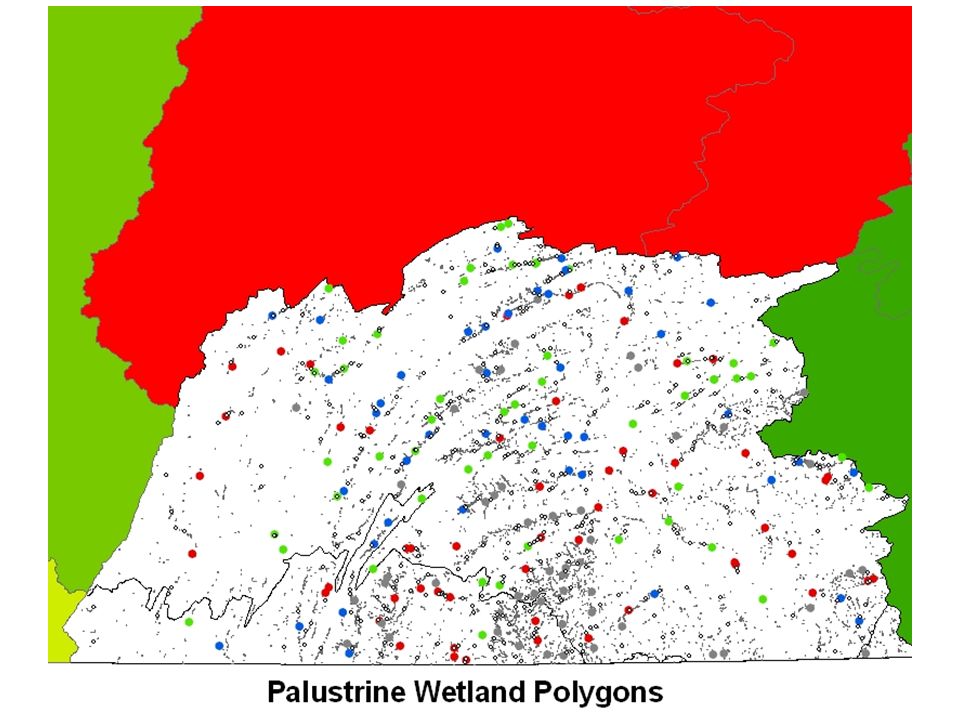
Wetland Design: Pennsylvania Monitoring Objectives Estimate number of hectares of palustrine wetlands that are in “good” condition based on a level 2 assessment for each basin in Pennsylvania and for four landcover classes within each basin Target Population and Resource Characteristics All mapped NWI vegetated wetlands within the Palustrine Emergent, Palustrine Scrub Shrub and Palustrine Forested classifications that have a predominance (>50%) of emergent, herbaceous or woody vegetation Elements are all possible locations within the mapped polygons Sample Frame NWI polygon shapefile restricted to palustrine classes defined Attributes added identify 4 landcover classes and reporting basins Institutional Constraints Monitoring to be completed over 5 years; each year a basin in each of the six reporting regions of state will be sampled Expected sample size of 50 in each landcover class in each basin Over sample of 200% due to sample frame deficiencies Spatially balanced survey design for an areal resource with unequal probability
 of emergent, herbaceous or woody vegetation Elements are all possible locations within the mapped polygons Sample Frame NWI polygon shapefile restricted to palustrine classes defined Attributes added identify 4 landcover classes and reporting basins Institutional Constraints Monitoring to be completed over 5 years; each year a basin in each of the six reporting regions of state will be sampled Expected sample size of 50 in each landcover class in each basin Over sample of 200% due to sample frame deficiencies Spatially balanced survey design for an areal resource with unequal probability")
44
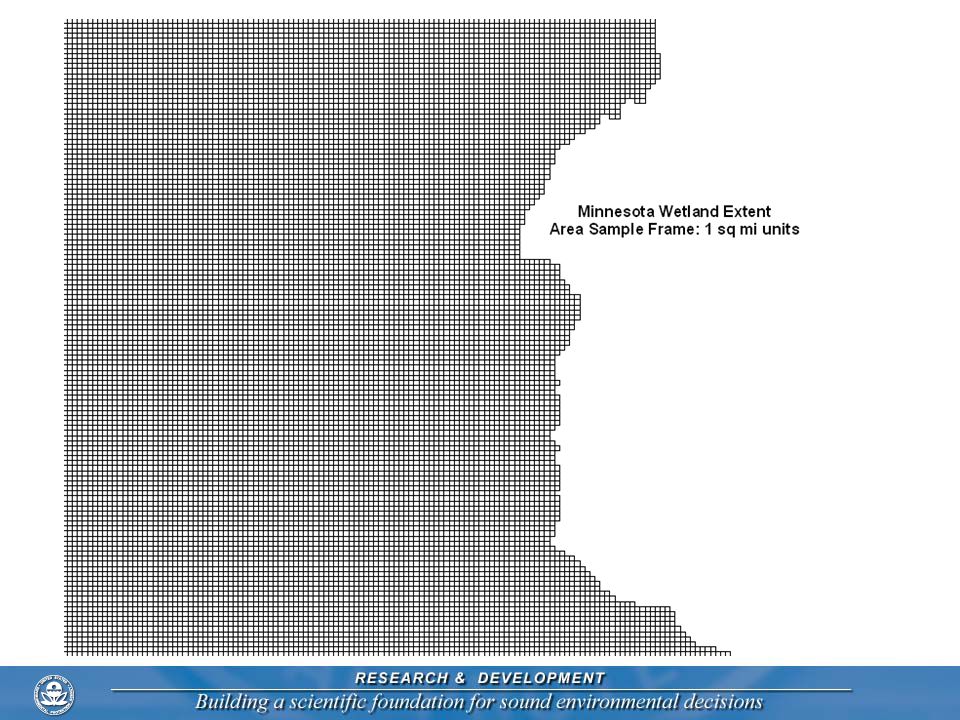
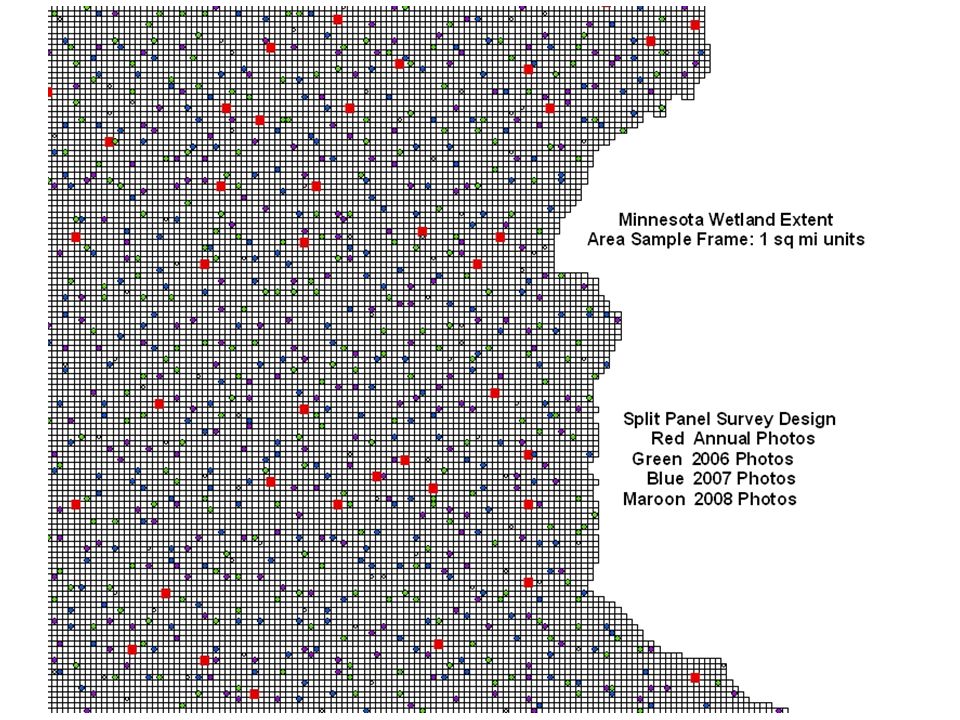
Wetland Design: Minnesota Monitoring Objectives Estimate total hectares of wetlands by wetland class and major basin in Minnesota Estimate number of hectares of depressional wetlands that are in good condition by major basin and state-wide Target Population and Resource Characteristics All wetlands that can be identified from aerial photointerpretation using USFWS NWI status and trends mapping procedures For extent the elements are 1 sq mile pixels that cover Minnesota For condition the elements are all locations within wetland polygons delineated on aerial photos Sample Frame For extent, a point shapefile of centroids of 1 sq mile pixels: an “area frame” For condition, all wetland polygons within sampled extent pixels Institutional Constraints 1800 1 sq mile pixels can be photo interpreted each year Must cover entire state each year Two stage survey design Stage 1: Split panel design (annual repeat panel, 3 year panels) equal probability Stage 2: GRTS design for area resource: remainder to be determined
 equal probability Stage 2: GRTS design for area resource: remainder to be determined")
46
Target Population, Sample Frame, Sampled Population We Live in an Imperfect World… Ideally, cyan, yellow, gray squares would overlap completely

47
http://www.epa.gov/nheerl/arm
Similar presentations


 R. Olsen USEPA NHEERL Western Ecology Division.>")
 and Bill Senior (Qld Environment and.>")


 determines what information managers need and then gathers, sorts, analyzes, stores, and distributes.>")


