Download presentation
Presentation is loading. Please wait.

1
DESIGN OF THE 1903 WRIGHT FLYER REPLICA MADRAS INSTITUE OF TECHNOLOGY CHENNAI - 44

2
WEIGHT ESTIMATION TOTAL WEIGHT 24.802 N

3
AERODYNAMIC DESIGN

4
Lift Calculation As the t/c ratio of the airfoil is less than 0.05 the classical theory of thin airfoils can be employed, by using this theory all the parameters other than drag is forecasted.

5
Drag Polar Induced Drag Estimation AR for a biplane = 4 b/c Span = 5 feet Chord length = 12 inches AR = 20 Gap = 9 inches CD i = 1/( AR)*(1+ )CL 2 C Di = 0.11136 C L 2 profile Profile Drag Calculation C D wet /C f = 1+ 1.5 (t/c) 3/2 +7 (t/c) 3 C Dp /C f = 60 (t/c C L /5) 4 The drag polar of our model is C D = 0.1303 + 0.1277C L 2
*(1+ )CL 2 C Di = C L 2 profile Profile Drag Calculation C D wet /C f = (t/c) 3/2 +7 (t/c) 3 C Dp /C f = 60 (t/c C L /5) 4 The drag polar of our model is C D = C L 2")
6
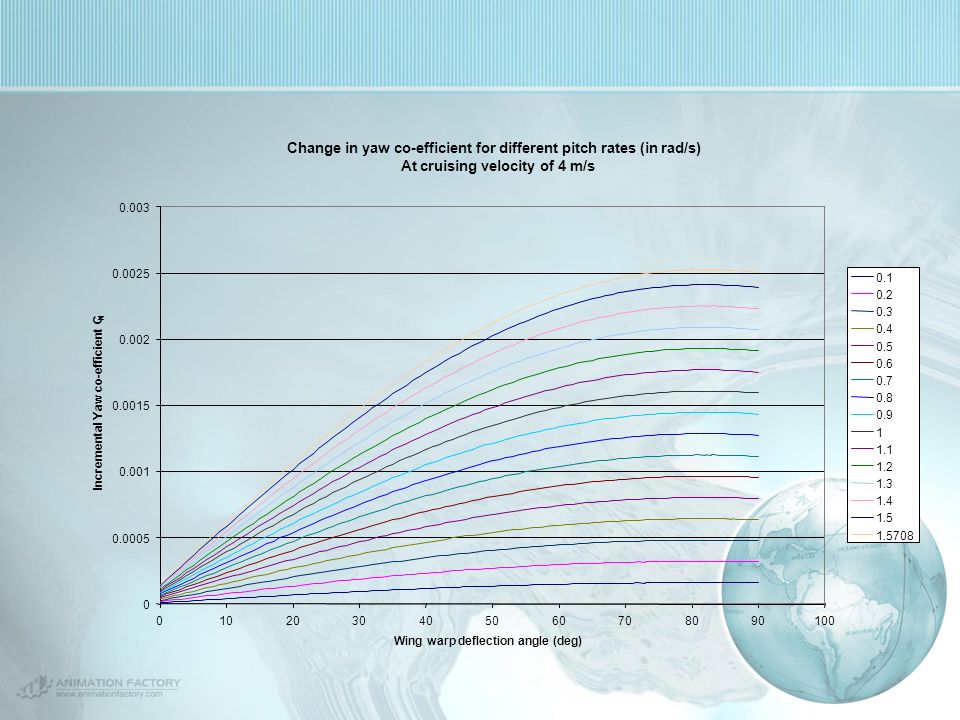
Wing warp

7
Rolling moment for Both wings = 0.56 (k/c) sin (l+ k cos ) 2 Where c is the chord of the wing is the angle of warp from the undisturbed configuration k is the length of wing warp
 sin (l+ k cos ) 2 Where c is the chord of the wing is the angle of warp from the undisturbed configuration k is the length of wing warp")
8
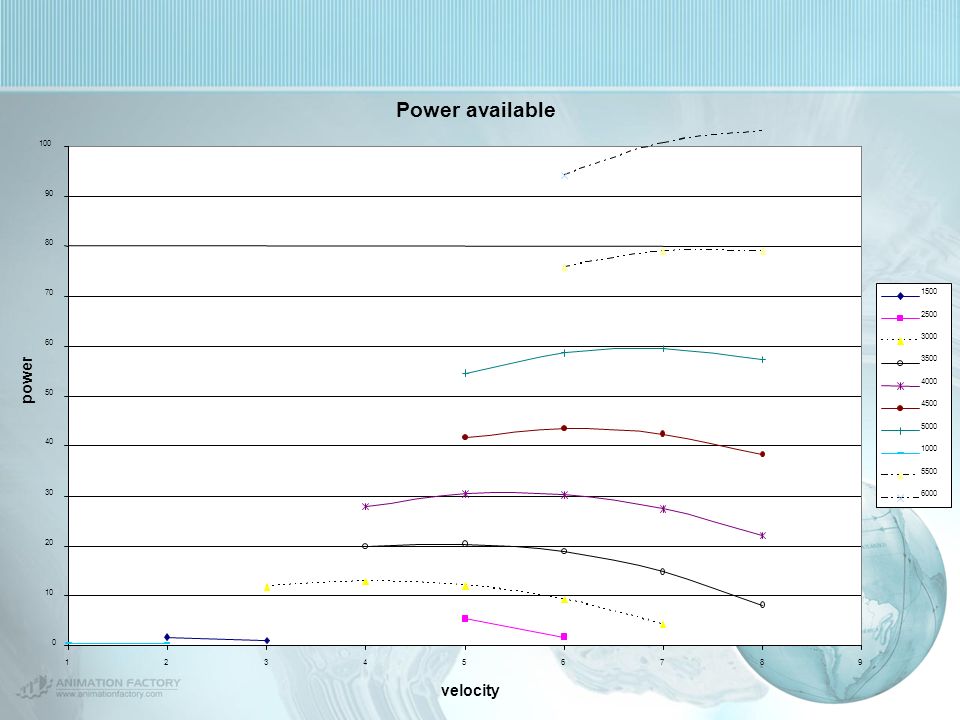
POWER PLANT SELECTION

10
specifications From drag calculations the power required 0.25 bHp Diameter of the propeller ( 2-blade propeller) 10 inches The diameter is determined from the thrust to be produced. The ground clearance was also taken into account while determining the diameter of the propeller.

11
STRUCTURAL DESIGN

12
WING FRONT SPAR The bending moment about X axis (M x ) = 14.96 Nm The formula used, M xc =(M x -(M y *I xy /I yy )) /( 1-I xy ²/ (I xx *I yy )) =36.65 Nm M yc =(M y -(M x *I xy /I xx )) / (1-I xy ²/ (I xx *I yy )) = -108.04 Nm The maximum stress on the front spar σ z = 32 MPa The maximum allowable bending stress for spruce wood = 41 MPa
 = Nm The formula used, M xc =(M x -(M y *I xy /I yy )) /( 1-I xy ²/ (I xx *I yy )) =36.65 Nm M yc =(M y -(M x *I xy /I xx )) / (1-I xy ²/ (I xx *I yy )) = Nm The maximum stress on the front spar σ z = 32 MPa The maximum allowable bending stress for spruce wood = 41 MPa")
13
WING REAR SPAR The maximum stress on the rear spar σ z = 40 MPa The maximum allowable bending stress for spruce wood = 41 MPa

14
ELEVATOR AND RUDDER SPARS ELEVATOR FRONT SPAR REAR SPAR RUDDER SPAR

15
Design of truss members Though the diameter of the truss members are different, for fabrication simplicity all the members are designed with diameter 5 mm.

16
PROPELLER SHAFT DESIGN The formula used to calculate the diameter of the shaft M e = (M +√(M²+T²)) / 2 = 0.15306 Nm T e = √(M²+T²) = 0.7938 Nm Maximum bending strength of the balsa wood σ b = 1.18934*10^7 N/m τ = 2482113 N/m² D moment =7.15 mm D torque =7.95 mm Therefore the required diameter for the propeller shafts = 8 mm
) / 2 = Nm T e = √(M²+T²) = Nm Maximum bending strength of the balsa wood σ b = *10^7 N/m τ = N/m² D moment =7.15 mm D torque =7.95 mm Therefore the required diameter for the propeller shafts = 8 mm")
17
MATERIALS TO BE USED S.NOCOMPONENTMATERIAL 1WING SPARSSPRUCE 2OTHER STRUCTURAL COMPONENTS BALSA 3SKINREYNOLDS PLASTIC 4FUEL TANKPLASTIC

18
PERFORMANCE CALCULATION

19
INTRODUCTION The performance design covers the five major calculations which are listed below Steady level flight performance Climb performance Range & Endurance Take – Off & Landing Turn Performance

20
LEVEL FLIGHT PERFORMANCE Cruising Velocity = 4.7 m/s Stalling Velocity = 2.35 m/s (C Lmax = 2.04) V minD = 2.64 m/s D min = 2.423 m/s P min = 6.09 W V minP = 2.06 m/s Range = 1.616 km (for cruise condition) Endurance = 5 minutes 54 seconds
 V minD = 2.64 m/s D min = m/s P min = 6.09 W V minP = 2.06 m/s Range = km (for cruise condition) Endurance = 5 minutes 54 seconds")
21
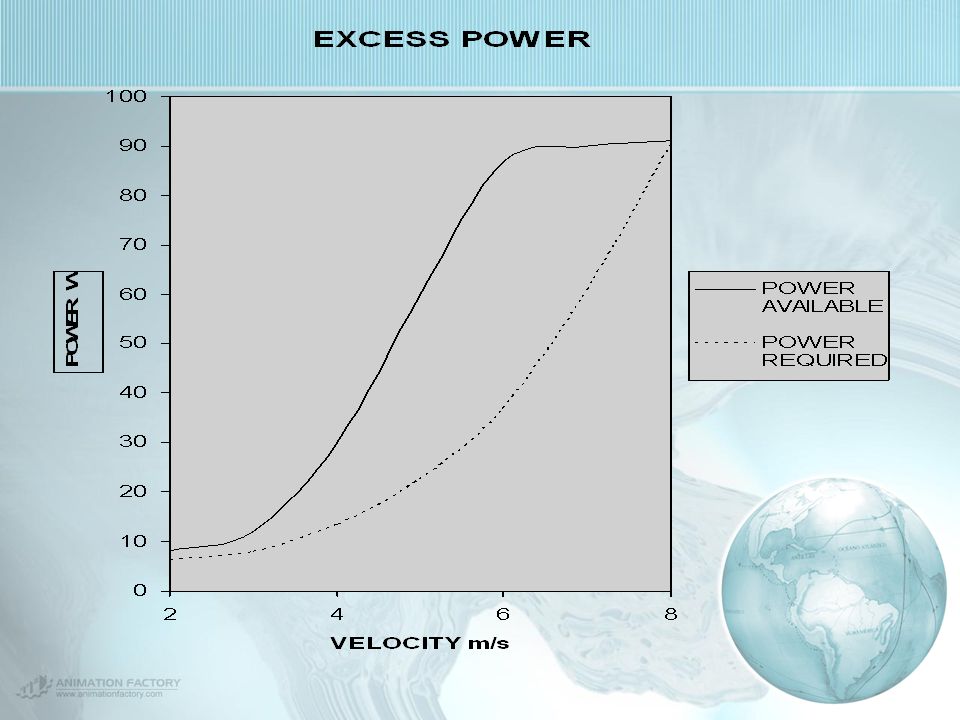
CLIMB PERFORMANCE R/C = Excess Power / Weight Excess Power = Power Available – Power Required Maximum rate of climb occurs at 6 m/s Velocity Power Available Power Required Excess Power R/C max Angle of Climb m/sWWW degree 286.1088971.8911030.0756442.167557 3127.838864.161140.1664463.180502 43013.484116.51590.6606369.50645 56022.5297637.470241.4988117.44327 69036.5518353.448172.13792720.87438 79060.9709129.029091.1611649.548366 89190.179250.8207510.032830.235128

23
Take – Off The take-off is curved up into 3 phases They are ground run, transition and initial climb upto 2 m and the same is repeated for landing Ground run V avg = 0.7 V LO (lift off velocity) = 0.84 V stall r = 0.1 for grass land V LO = 2.82 m/s C LLO = 0.8 C Lmax Ground Run = 6.3 m Ground Run in transition = 2.1 m Ground Run in climb = 4.48 m Total take off distance = 12.88 m Ground Run TransitionClimb
 = 0.84 V stall r = 0.1 for grass land V LO = 2.82 m/s C LLO = 0.8 C Lmax Ground Run = 6.3 m Ground Run in transition = 2.1 m Ground Run in climb = 4.48 m Total take off distance = m Ground Run TransitionClimb")
24
Landing & Turning performance Landing distance total = 17.11 m Minimum turn radius = 0.4 m Corresponding time taken = 1.15 seconds V-n diagram is a plot between the velocity and load factor ( n = L/W) It gives the structural limit (max) of the aircraft and the highest and lowest possible velocity that can be reached by the aircraft The maximum load factor = 275/25 = 11
 It gives the structural limit (max) of the aircraft and the highest and lowest possible velocity that can be reached by the aircraft The maximum load factor = 275/25 = 11")
25
V-n DIAGRAM From the v-n diagram it is clear that n is maximum for the velocity of 8 m/s and the maximum velocity can be 35.75 m/s for the n value less than 11

26
STABILITY ANALYSIS

27
LONGITUDINAL STATIC STABILITY

28
DIRECTIONAL STATIC STABILITY

29
CROSS COUPLING EFFECT

31
COST ESTIMATION

32
RADIO CONTROL COMPONENTS Engine throttle is controlled by servo motor. Four channel receiver set with 4 servo motors and connectors are used. The R/C unit weighs about 0.75 N. The R/C unit is placed just below the wing so that it reduces the bending moment caused by the lift.

33
POSITION OF SERVOS

34
POSITION OF RECEIVER

35
PROBLEMS We are amateur designers But we are confident that we can overcome this problem after taking part in this workshop Since the stability of the aircraft is at a high risk we feel that flying the aircraft safely would require a lot of training

Similar presentations


 is controlled remotely by a hand held transmitter & receiver within the aircraft. The.>")


 Brian Martinez (Organizer) Mohammed Ramadan (Financial Officer) Noe Caro (Historian) Brian Martinez.>")


 Brian Martinez (Organizer) Mohammed Ramadan (Financial Officer) Noe Caro (Historian) SAE AERO Chase Beatty.>")
 Matthew Maberry Travis Cushman Benjamin Waller Zach Veilleux Joseph Travaglini.>")


