Download presentation
Presentation is loading. Please wait.

1
Paulin Basinga Rwanda School of Public Health Christel Vermeersch World Bank A collaboration between the Rwanda Ministry of Health, CNLS, SPH, INSP Mexico, UC Berkeley and the World Bank

2
Our team… Research Team Paulin Basinga, National University of Rwanda Paul Gertler, UC Berkeley Jennifer Sturdy, World Bank and UC Berkeley Christel Vermeersch, World Bank Policy Counterpart Team Agnes Binagwaho, Rwanda MOH and CNLS Louis Rusa, Rwanda MOH Claude Sekabaraga, Rwanda MOH Agnes Soucat, World Bank

3
The 2005 starting point Professionally assisted births: 40% Maternal Mortality: 750 per 100,000 live births Infant Mortality : 86 per 1,000 HIV : 3.1% 3 Source: Rwanda 2005: results from the demographic and health survey. 2008. Studies in family planning, 39(2), pp. 147-152.
, pp")
4
Why a pay reform? 4 Inefective reward system Shortage of human resources Low productivity & motivation Poor quality of service Low user satisfaction & low usage High mortality & morbidity

5
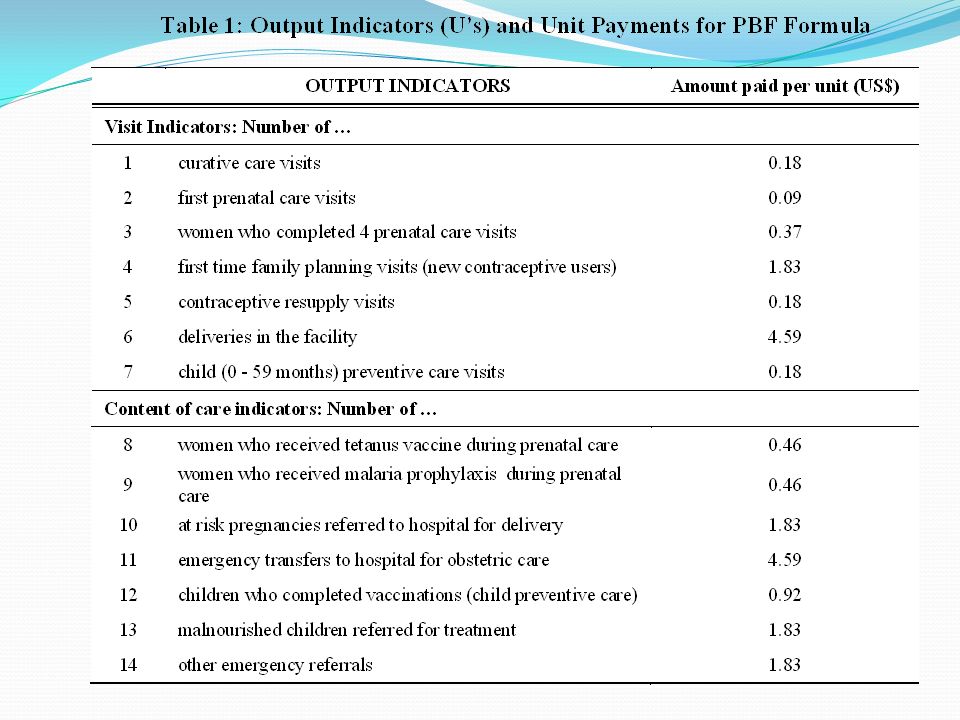
P4P for Health in Rwanda Objectives Focus on maternal and child health (MDGs 4 & 5) Increase quantity and quality of health services provided Increase health worker motivation What? Financial incentives to providers t For more quantity And more quality How? Contracts between g overnment & health facilities When? Piloted in 2001-2005, full scale from 2006 5

8
8

9
Evaluation Questions Did P4P improve… … the quality and quantity of maternal and child health services? … the health of the population?

10
Conceptual framework for quality What they know (Ability/Technology) What They Do (Quality) Production Possibility Frontier Productivity Gap Conditional on Ability Actual Performance
 What They Do (Quality) Production Possibility Frontier Productivity Gap Conditional on Ability Actual Performance")
11
Identifying the impact of P4P When we see a change in outcome, how do we know it is caused by P4P? And not by something else Evaluate the impact = identifying a comparison group Equivalent to the treated group in all aspects Except that they receive the treatment Gold standard: randomized evaluation 11

12
Evaluation Design Phased roll-out at district level Identified districts without P4P in 2005 Group districts into “similar pairs” based on population density, location & livelihoods Randomly assign one to treatment and other to control Phase I: 12 districts, started 2006 Phase II: 7 districts, started 2008 Unit of observation is health facility 12

13
Rollout of P4P 2006 – 2008 13

14
A few challenges The decentralization “surprise” A few new districts had some facilities with P4P– must be treatment Exposure time to the “treatment” Is it more money? Or more incentives? Other interventions & time trends Coordination with multiple donors 14

15
Data Independent data Facilities level Utilization (quantity) Structural quality Knowledge (vignettes) Process quality (patient exit surveys) Household level Utilization Process quality Health outcomes 15
 Structural quality Knowledge (vignettes) Process quality (patient exit surveys) Household level Utilization Process quality Health outcomes 15")
16
Sample Out of 30 districts 12 Phase I (treatment) 7 Phase II (comparison) 165 health facilities All rural health centers located in 19 districts 2156 households in catchment areas Power calculations based on expected treatment effect on prenatal care visits, institutional delivery Panel data: 2006 and 2008 16
 7 Phase II (comparison) 165 health facilities All rural health centers located in 19 districts 2156 households in catchment areas Power calculations based on expected treatment effect on prenatal care visits, institutional delivery Panel data: 2006 and")
17
Econometric model Basic difference-in-differences model specified as a two-way fixed effect cross-sectional time-series regression models. 17 where : Y ijt is the outcome of interest for individual i living in facility j’s catchment area in year t; PBF j,2008 = 1 if facility j was paid by PBF in 2008 and 0 if otherwise; j are facility fixed effects; γ 2008 =1 if the year is 2008 and 0 if 2006; X itk are time varying individual characteristics; ijt is a zero mean error term.

18
Evaluation design challenges Organizational Managing expectations The John Henry effect in practice Building capacity Time & effort Technical Small sample size Reconciling provider and client data 18

19
Baseline, health facilities 19

20
Baseline, utilization of maternal health services 20

21
Baseline, women 15-49 with birth in last 24 months 21

22
22

23
Impact on structure quality Impact of PBFTime Trend N Treatment 2008 (=1)SD2008 (=1)SD Availability of vaccines 1550.703**(0.355)-0.514***(0.122) Prenatal care service 1550.062(0.426)-0.659***(0.100) Delivery service 1550.239(0.286)-0.484***(0.083) 23
SD2008 (=1)SD Availability of vaccines **(0.355)-0.514***(0.122) Prenatal care service (0.426)-0.659***(0.100) Delivery service (0.286)-0.484***(0.083) 23")
26
Impact on quality of prenatal care Impact of PBFTime Trend N Treatment 2008 (=1)SD2008 (=1)SD Total Prenatal Quality Score (standardized score) 36830.157***(0.048)0.090***(0.032) Tetanus vaccine during prenatal visit (=1) 28100.054**(0.023)0.032(0.028) Productivity ratio37570.072***(0.017)0.036***(0.012) Treatment * 2008 * Competency > 75% (=1) 37390.088***(0.019)NA 26
SD2008 (=1)SD Total Prenatal Quality Score (standardized score) ***(0.048)0.090***(0.032) Tetanus vaccine during prenatal visit (=1) **(0.023)0.032(0.028) Productivity ratio ***(0.017)0.036***(0.012) Treatment * 2008 * Competency > 75% (=1) ***(0.019)NA 26")
27
Impact on quality of prenatal care 27

28
Impact on use of prenatal care Impact of PBFTime Trend N Treatment 2008 (=1)SD2008 (=1)SD Number of prenatal visits received 2223-0.028(0.066)0.237***(0.056) Likelihood of first prenatal visit in first trimester 22230.020(0.036)0.163***(0.029) Made 4 or more prenatal care visits 22230.009(0.039)0.121***(0.023) 28
SD2008 (=1)SD Number of prenatal visits received (0.066)0.237***(0.056) Likelihood of first prenatal visit in first trimester (0.036)0.163***(0.029) Made 4 or more prenatal care visits (0.039)0.121***(0.023) 28")
29
Impact on use of maternal services Impact of PBFTime Trend N Treatment 2008 (=1)SD2008 (=1)SD Institutional delivery (=1) 21080.077**(0.034)0.134***(0.023) Delivery attended by Qualified Provider (=1) 22740.083**(0.035)0.195***(0.028) Use of any modern contraceptive method (=1) 3121-0.017(0.023)0.245***(0.033) 29
SD2008 (=1)SD Institutional delivery (=1) **(0.034)0.134***(0.023) Delivery attended by Qualified Provider (=1) **(0.035)0.195***(0.028) Use of any modern contraceptive method (=1) (0.023)0.245***(0.033) 29")
30
Impact on institutional delivery 30

31
What our results tell us You get what you pay for ! Need to get prices “right” Returns to effort important Bigger effects in things more in provider’s control Patient or community health workers for prenatal care/Immunization Provide incentives directly to pregnant women? (conditional cash transfer program). Financial incentive to community health workers Low quality of care : additional training coupled with P4P Evaluation feedback useful 31
. Financial incentive to community health workers Low quality of care : additional training coupled with P4P Evaluation feedback useful 31.")
32
Discussion Prenatal care : entry point! Increase in utilization nationwide due to: Mutuelle Imihigo HIV services Safe motherhood and PCIME Possible spill over effect to child health 32

33
Limitations ! The original randomized designed was changed due to the political decentralization process: But sample well balanced! Trend analysis with HMIS data ongoing No measure of all paid and some non paid indicators : HMIS analysis Cost effectiveness analysis 33

34
Acknowledgments Funding by: World Bank Government of Rwanda (PHRD grant) Bank-Netherlands Partnership Program (BNPP) ESRC/DFID GDN
 Bank-Netherlands Partnership Program (BNPP) ESRC/DFID GDN")
35
35

Similar presentations


 Government of Pakistan Saving Children’s lives through Community based Interventions.>")


