Download presentation
Presentation is loading. Please wait.

1
Organization Strategy and Project Selection

2
Learning Objectives To describe the primary objectives of project management To discuss the strategic management process and how projects are incorporated To analyze results for project selection based on various assessment tools

3
Project Objectives Project Objective Causes that would impact a project: Performance Unexpected technical problems arise. Insufficient resources are available when they are needed Client requires changes in specifications. Interfunctional (departmental) complications arise Cost (Budget) The scope fo the work increases. Initial bids or estimates were too low. Budgeting was inadequate. Reporting was poor or untimely. Time Initial time estimates were optimistic. Task sequencing was incorrect. Required inputs of material, personnel, or equipment were unavailable when needed. Customer-generated change orders required rework. Governmental regulations were altered.
 complications arise Cost (Budget) The scope fo the work increases. Initial bids or estimates were too low. Budgeting was inadequate. Reporting was poor or untimely. Time Initial time estimates were optimistic. Task sequencing was incorrect. Required inputs of material, personnel, or equipment were unavailable when needed. Customer-generated change orders required rework. Governmental regulations were altered..")
4
Why Project Managers Need to Understand the Strategic Management Process Changes in the organization’s mission and strategy Project managers must respond to changes with appropriate decisions about future projects and adjustments to current projects. Project managers who understand their organization’s strategy can become effective advocates of projects aligned with the firm’s mission. 2–4

5
Projects and Strategy Mistakes caused by not understanding the role of projects in accomplishing strategy: Focusing on problems or solutions with low strategic priority. Focusing on the immediate customer rather than the whole market place and value chain. Overemphasizing technology that results in projects that pursue exotic technology that does not fit the strategy or customer need Trying to solve customer issues with a product or service rather than focusing on the 20% with 80% of the value (Pareto’s Law). Engaging in a never-ending search for perfection only the project team really cares about. 2–5
. Engaging in a never-ending search for perfection only the project team really cares about. 2–5.")
6
The Strategic Management Process: An Overview Strategic Management Requires every project to be clearly linked to strategy. Provides theme and focus of firm’s future direction. Responding to changes in the external environment—environmental scanning Allocating scarce resources of the firm to improve its competitive position— internal responses to new programs Requires strong links among mission, goals, objectives, strategy, and implementation. 2–6

7
Strategic Process Mission External environment Goals & objectives Portfolio of choices Strategy formulation Internal environment Strategy implementation

8
Goals must include 5 necessary SMART attributes: S Specific Measurable Attainable Relevant Time bound MART

9
TEST YOUR UNDERSTANDING Tell either if it is a Bad or Good and why based on SMART categories

10
At next Monday’s meeting verify that everyone is familiar with the new safety procedures. Good. Meets feasible and measurable

11
As soon as possible, reduce to 10 minutes the time taken to process an invoice. Bad. Not very feasible given the time allotted is not specific.

12
Reduce by 25% the amount of paper thrown into the wastepaper bin before the end of the next month. Good. Meets measurable, feasible, deadline given which can be reasonable.

13
Financial Models The Payback Model Measures the time the project will take to recover the project investment. Uses more desirable shorter paybacks. Emphasizes cash flows, a key factor in business. Limitations of Payback: Ignores the time value of money. Assumes cash inflows for the investment period (and not beyond). Does not consider profitability. 2–13
. Does not consider profitability. 2–13.")
14
Financial Models (cont’d) The Net Present Value (NPV) model Uses management’s minimum desired rate-of-return (discount rate) to compute the present value of all net cash inflows. Positive NPV: project meets minimum desired rate of return and is eligible for further consideration. Negative NPV: project is rejected. 2–14

15
Assessment tools

16
Identify and Select the problem Sources Press Ganey Studer Group SERVQual surveys Voice of Customer Observation of processes

17
QFD – Voice of the Customer

18
Four Steps of QFD

19
Solution Assessment Tool 19

20
How it Works 20 Clarify what we mean by “impact” and “do-ability”. Explain how we will use a matrix to weight suggestion “do-ability”. Each suggestion has to be evaluated by group for consensus in scoring. Suggestions should be plotted on the Solution Assessment Matrix. Challenge these final results by having the group review the plot and concur or disagree with how the suggestions fell on the plot. Spend time discussing any disagreements.

21
Solution Assessment in Action Solution Assessment Do-Ability Weighting Matrix CostEffortRiskDo-Ability Score Weight50%30%20%1 thru 4 SuggestionScore 11221.5 24112.5 3411 43232.7 51221.5 64112.5 74413.4 84212.8 93412.9 101141.6 21 1= poor score. Ex. Score a 1 in the cost column if suggestion would be costly. 4 = good score. Ex. Score a 4 in the risk column if suggestion has no risk.

22
Solution Assessment in Action Assessment Scores Do-Ability ScoreImpact Score SuggestionScore 11.53 22.51 3 1 42.73 51.52 62.54 73.41 82.81 92.91 101.63 22

23
Solution Assessment in Action 23 Based on the plot results, highest priority is given to implementing suggestion #’s 6, 4, & 10.

24
Histogram 24 Histogram for a frequency distribution based on quantitative data is very similar to the bar chart showing the distribution of qualitative data. The classes are marked on the horizontal axis and the class frequencies on the vertical axis. The class frequencies are represented by the heights of the bars.

25
Histogram Chart Use if you want to determine which category of item, you focus your efforts on. Study current conditions – problem identification

26
Pareto Chart What Questions The Pareto Chart Answers 1.What are the largest issues facing our team or business? 2.What 20% of sources are causing 80% of the problems (80/20 Rule)?80/20 Rule 3.Where should we focus our efforts to achieve the greatest improvements? Identify Problems
 80/20 Rule 3.Where should we focus our efforts to achieve the greatest improvements. Identify Problems.")
27
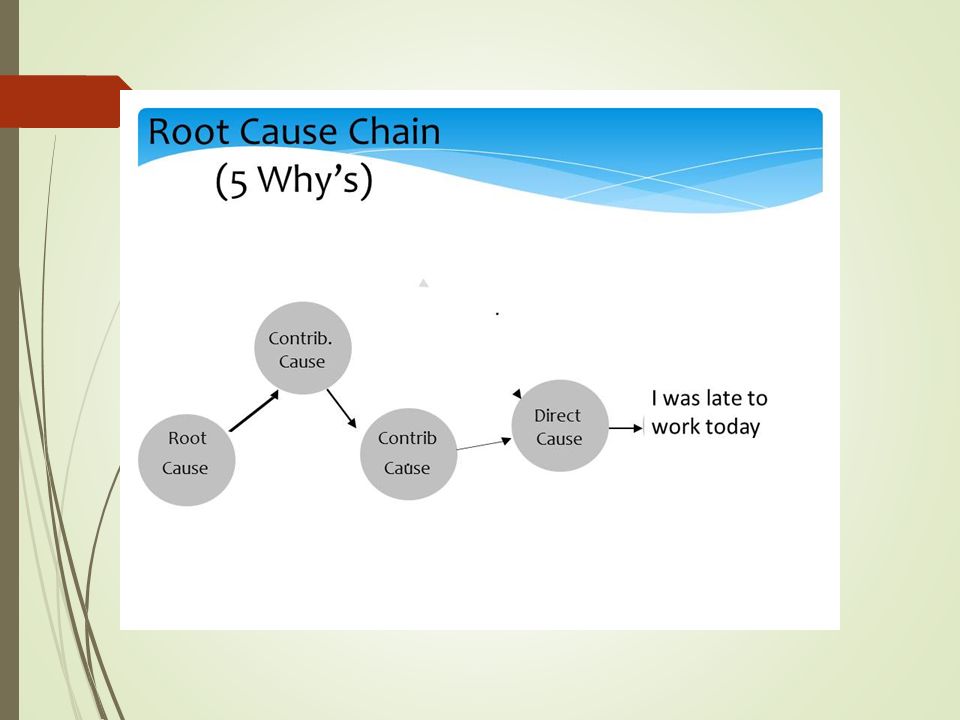
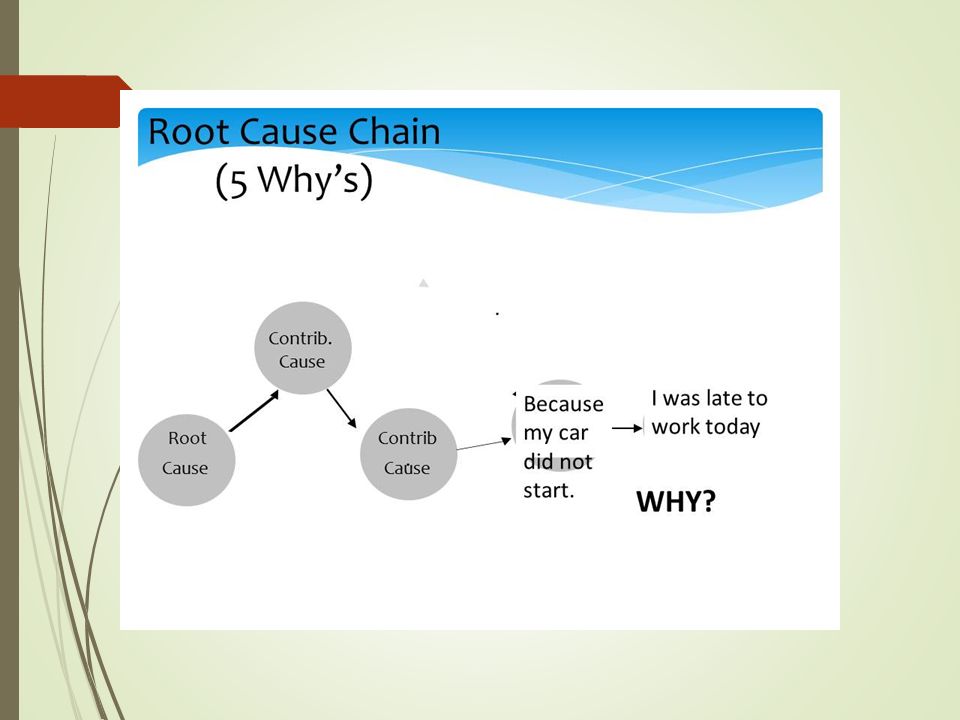
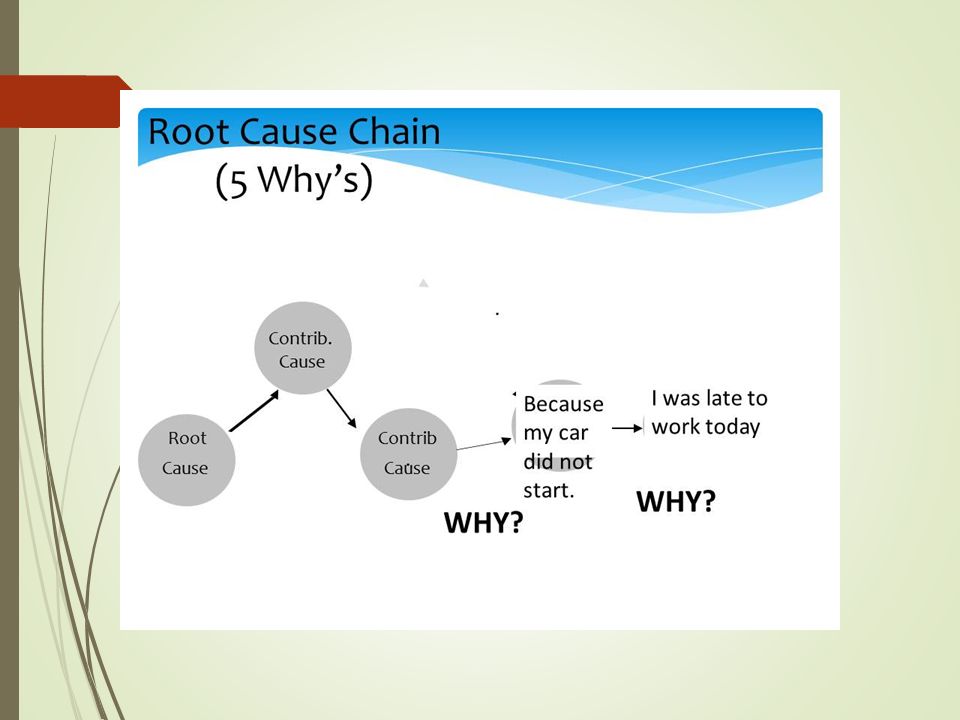
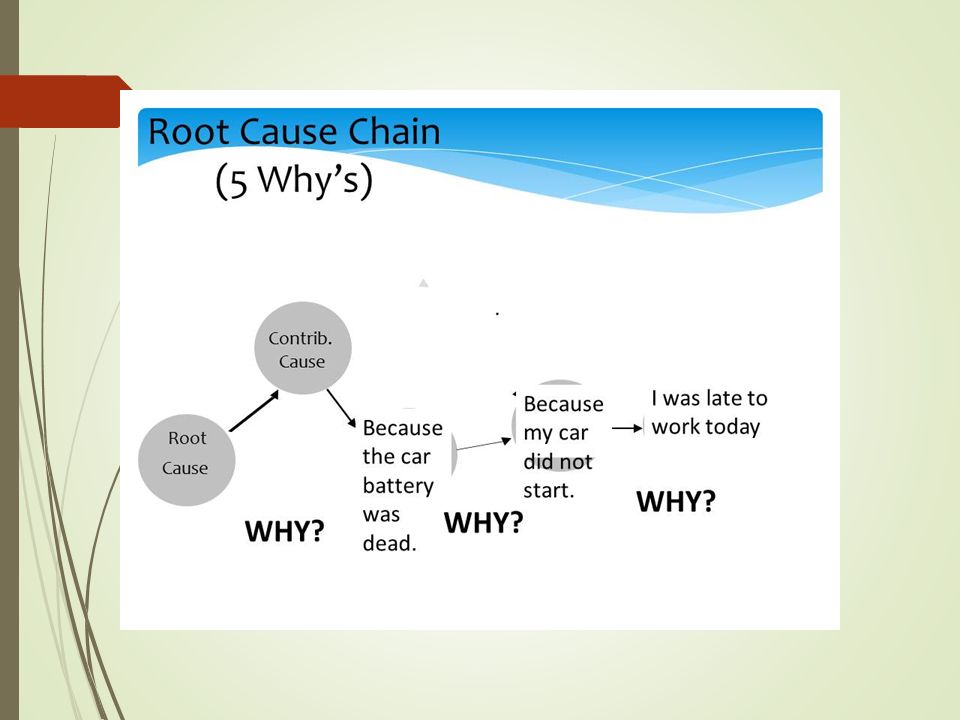
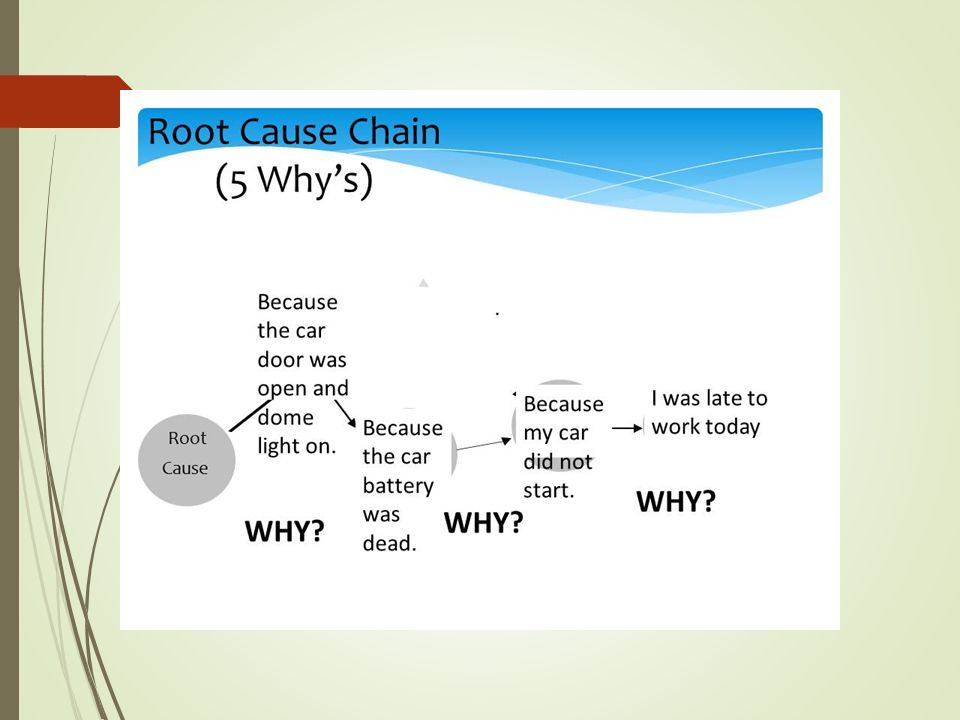
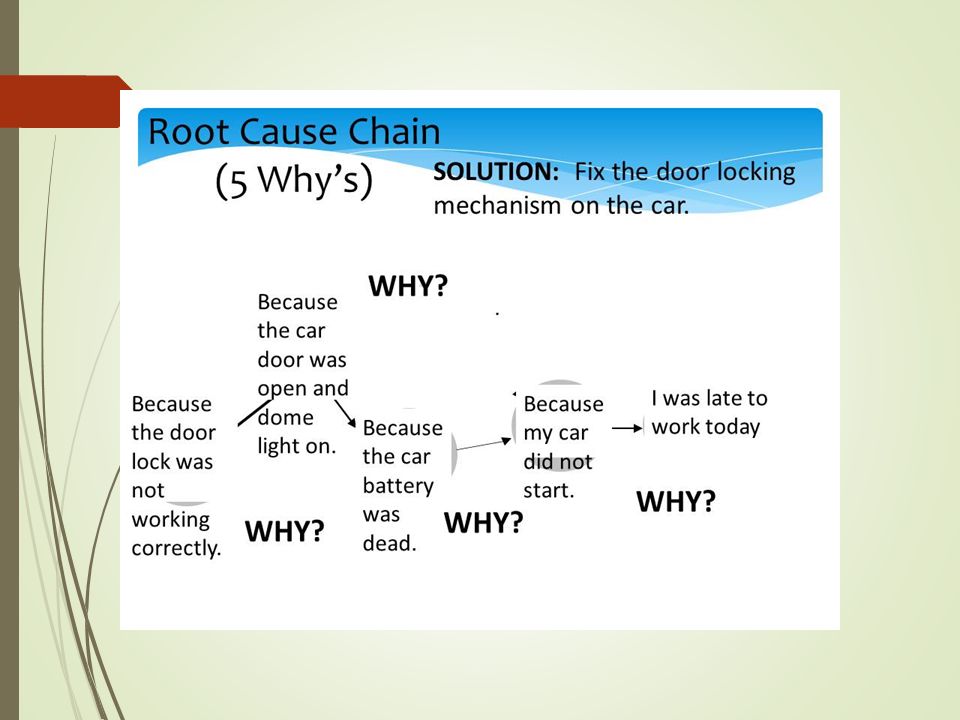
5 Whys Method Benefits Help identify the root cause of a problem Determine relationship between different root causes of a problem One of the simplest tools; easy to complete without statistical analysis

28
Root Cause Contrib. Cause Contrib. Cause Direct Cause Event Contrib. Cause Cause Chain

29
How to complete the 5 Whys Write down the specific problem. Ask Why problem happens and write down the answer If the answer doesn’t identify root cause then repeat. Keep repeating until team is in agreement that problem’s root cause is identified.

30
Root Cause Analysis Example

47
Line Chart – observe the trend for call times over time. Suppose call times were reduced by a process improvement. Case B Case C Process improvement

48
Nonfinancial Strategic Criteria To capture larger market share To make it difficult for competitors to enter the market To develop an enabler product, which by its introduction will increase sales in more profitable products To develop core technology that will be used in next-generation products To reduce dependency on unreliable suppliers To prevent government intervention and regulation 2–48

49
Any Questions?

Similar presentations


>")


