Download presentation
Presentation is loading. Please wait.

1
Random Variable

2
Random variable A random variable χ is a function (rule) that assigns a number to each outcome of a chance experiment. A function χ acts on the elements of its domain (the sample space) associating each element with a unique real number. The set of all values assigned by the random variable is the range of this function. If that set is finite, then the random variable is said to be finite discrete. If that set is infinite but can be written as a sequence, then the random variable is said to be infinite discrete. If that set is an interval then the random variable is said to be continuous.
 associating each element with a unique real number. The set of all values assigned by the random variable is the range of this function. If that set is finite, then the random variable is said to be finite discrete. If that set is infinite but can be written as a sequence, then the random variable is said to be infinite discrete. If that set is an interval then the random variable is said to be continuous..")
3
Example (1) A coin is tossed 3 times. Let the random variable χ denotes the number of heads that occur in 3 tosses. 1. List the outcomes of the experiment (Find the domain of the function χ) Answer: The outcomes of the experiments are those of the sample space S = { HHH, HHT, HTH, THH, HTT, THT, TTH, TTT } = the domain of the function (random variable) χ 2. Find the value assigned to each outcome by χ See the table on the following slide.
 Answer: The outcomes of the experiments are those of the sample space S = { HHH, HHT, HTH, THH, HTT, THT, TTH, TTT } = the domain of the function (random variable) χ 2. Find the value assigned to each outcome by χ See the table on the following slide..")
4
Value of ΧOutcome 3HHH 2HHT 2HTH 2THH 1HTT 1THT 1TTH 0TTT

5
3. Let E be the event containing the outcomes to which a value of 2 has been assigned by χ. Find E! Answer: E = {HHT, HTH, THH } 4. Is χ finite discrete, infinite discrete or continuous? Answer: The set of the values assigned by χ is: { 0, 1, 2, 3}, which is a finite set, hence the random variable is χ finite discrete

6
Example (2) A coin is tossed repeatedly until a head occurs. Let the random variable χ denotes the number coin tosses in the experiment 1. List the outcomes of the experiment (Find the domain of the function χ) Answer The outcomes of the experiments are those of the sample space S = { H, TH, TTH, TTTH, TTTTH, TTTTTH, TTTTTTH, …. } = the domain of the function (random variable) χ 2. Find the value assigned to each outcome by χ See the table on the following slide which shows some of these values.
 Answer The outcomes of the experiments are those of the sample space S = { H, TH, TTH, TTTH, TTTTH, TTTTTH, TTTTTTH, …. } = the domain of the function (random variable) χ 2. Find the value assigned to each outcome by χ See the table on the following slide which shows some of these values..")
7
Value of ΧOutcome 1H 2TH 3TTH 4TTTH 5TTTTH 6TTTTTH 7TTTTTTH …..….Etc etc

8
3. Is χ finite discrete, infinite discrete or continuous? Answer: The set of the values assigned by χ is: {1, 2, 3, 4, 5, 6, 7, 8, 9, ……..}, which is a infinite set, that can written as a sequence, hence the random variable is χ is infinite discrete

9
Example (3) A flashlight is turned on until the battery runs out. Let the Radom variable χ denote the length (time) of the life of the battery. What values may χ assume ? Is χ finite discrete, infinite discrete or continuous? Answer: The set of possible values is the interval [0,∞), and hence the random variable χ is continuous.
 of the life of the battery. What values may χ assume . Is χ finite discrete, infinite discrete or continuous. Answer: The set of possible values is the interval [0,∞), and hence the random variable χ is continuous..")
10
Probability Distribution of Random variable

11
A table showing the probability distribution associated with the random variable ( which is associated with the experiment) rather than with the outcomes (which are related to the random variable)
 rather than with the outcomes (which are related to the random variable)")
12
Example (4) A coin is tossed 3 times. Let the random variable χ denotes the number of heads that occur in 3 tosses. Show the probability distribution of the random variable associated with the experiment.

13
Value of ΧOutcome 3HHH 2HHT 2HTH 2THH 1HTT 1THT 1TTH 0TTT

14
probability distribution of the random variable X P(X=x)Value of Χ 1/80 3/81 2 1/83
Value of Χ 1/80 3/81 2 1/83")
15
Example (5) Two dice are rolled. Let the random variable χ denotes the sum of the numbers on the faces that fall uppermost. Show the probability distribution of the random variable X. Answer: The values assumed by the random variable X are 2, 3, 4, 5, 6,….,12, corresponding to the events E 2, E 3, E 4,….,E 12. The probabilities associated with the random variable X corresponding to 2, 3, 4, …,12 are the probabilities p(E 2 ), p(E 3 ),, p(E 4 ), …., p(E 12 )..
, p(E 3 ),, p(E 4 ), …., p(E 12 )...")
16
Sum of uppermost numbersEvent E k { (1,1) } 2 { (1,2), (2,1) } 3 { (1,3), (2, 2), (3,1) } 4 { (1, 4), (2, 3), (3, 2), (4,1) } 5 { (1, 5 ), (2, 4), (3, 3), (4, 2), (5,1) } 6 {(1, 6), (2, 5), (3,4), (4, 3), (5, 2), (6,1)} 7 { (2, 6), (3, 5), (4, 4), (5,1), (6, 2) } 8 { (3, 6), (4, 5), (5, 4), (6, 3) } 9 { (4, 6), (5, 5), (6, 4) } 10 { (5, 6), (6, 5) } 11 {(6,6)} 12
 } 2 { (1,2), (2,1) } 3 { (1,3), (2, 2), (3,1) } 4 { (1, 4), (2, 3), (3, 2), (4,1) } 5 { (1, 5 ), (2, 4), (3, 3), (4, 2), (5,1) } 6 {(1, 6), (2, 5), (3,4), (4, 3), (5, 2), (6,1)} 7 { (2, 6), (3, 5), (4, 4), (5,1), (6, 2) } 8 { (3, 6), (4, 5), (5, 4), (6, 3) } 9 { (4, 6), (5, 5), (6, 4) } 10 { (5, 6), (6, 5) } 11 {(6,6)} 12")
17
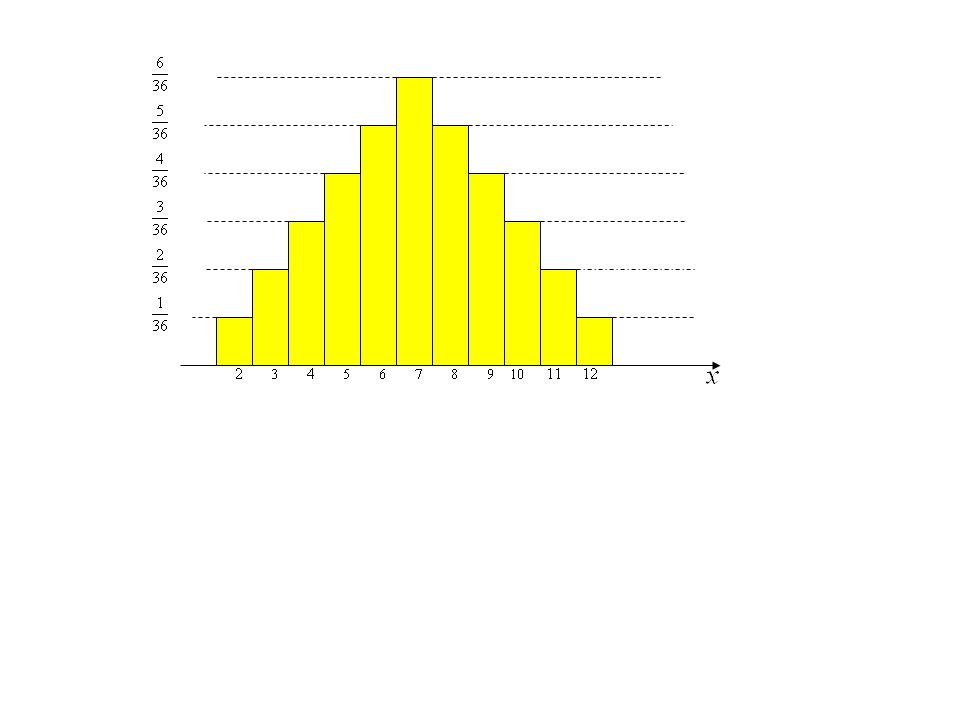
Probability Distribution of the Random Variable X p(X=x)x 1/362 2/363 3/364 4/365 5/366 6/367 5/368 4/369 3/3610 2/3611 1/3612
x 1/362 2/363 3/364 4/365 5/366 6/367 5/368 4/369 3/3610 2/3611 1/3612")
18
Example (6) The following table shows the number of cars observed waiting in line at the beginning of 2 minutes interval from 10.00 am to 12.00 noon at the drive-in ATM of QNB branch in Ghrafa and the corresponding frequency of occurrence. Show the probability distribution table of the random variable x denoting the number of cars observed waiting in line. Frequency of Occurrence Cars 20 91 162 123 84 65 46 27 18

19
Dividing the frequency by 60 (the sum of these numbers- the ones indicating frequency ), we get the respective probability associated with random variable X. Thus: P(X=0) = 2/60 =1/30 ≈0.03 P(X=1) = 9/60 = 3/20 =0.15 P(X=2) = 16/60 = 1/10 = 0.1 ….etc See the opposite table Frequency of Occurrence p(X = x) Cars x 2/60 ≈ 0.030 9/60 ≈ 0.151 16/60 ≈ 0.272 12/60 ≈ 0.203 8/60 ≈ 0.134 6/60 ≈ 0.105 4/60 ≈ 0.076 2/60 ≈ 0.037 1/60 ≈ 0.028
 = 2/60 =1/30 ≈0.03 P(X=1) = 9/60 = 3/20 =0.15 P(X=2) = 16/60 = 1/10 = 0.1 ….etc See the opposite table Frequency of Occurrence p(X = x) Cars x 2/60 ≈ /60 ≈ /60 ≈ /60 ≈ /60 ≈ /60 ≈ /60 ≈ /60 ≈ /60 ≈")
20
Bar Charts ( Histograms ) A bar chart or histogram is a graphical means of exhibiting probability distribution of a random variable. For a given probability distribution, a histogram is constructed as follows: 1. Locate the values of the random variable on the number line (x-axis) 2. Above each number (value) erect a rectangle of width 1 and height equal to the probability asociated with that number (value).
 2. Above each number (value) erect a rectangle of width 1 and height equal to the probability asociated with that number (value)..")
21
1. The area of rectangle associated with the value of the random variable x = The probability associated with the value x (notice tat the width of the rectangle is 1) 2. The probability associated with more than one value of the random variable x is given by the sum of the areas of the rectangles associated with those values. Remarks
 2. The probability associated with more than one value of the random variable x is given by the sum of the areas of the rectangles associated with those values. Remarks.")
22
Example Back to the example of three tosses of the coin

23
Value of ΧOutcome 3HHH 2HHT 2HTH 2THH 1HTT 1THT 1TTH 0TTT

24
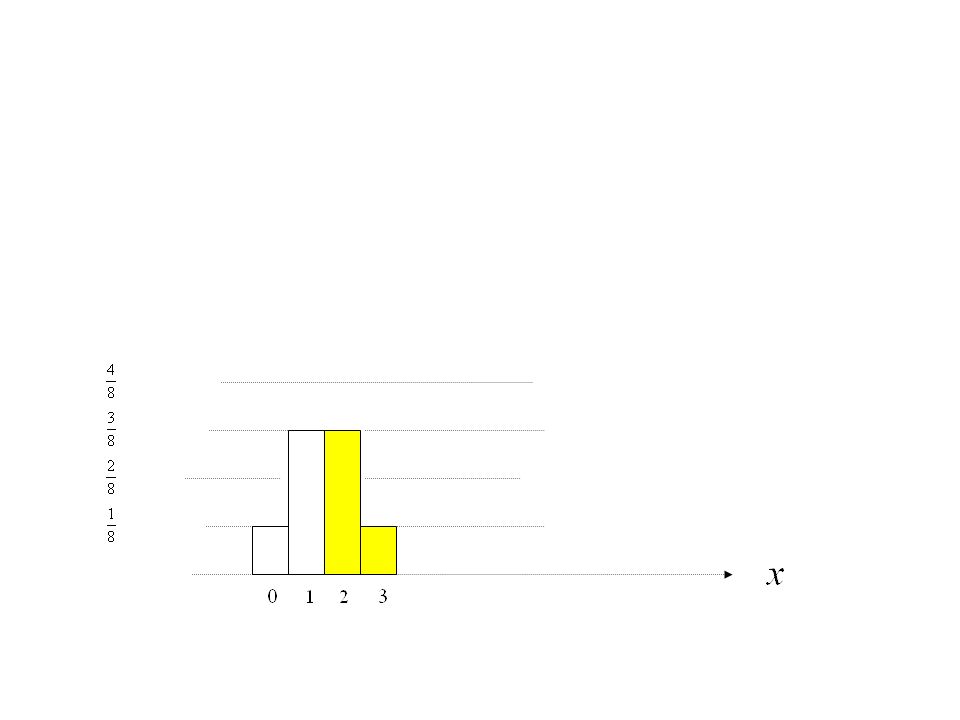
Probability Distribution x p(X=x) 0 1/8 1 3/8 2 3/8 3 1/8 Value of ΧOutcome 3HHH 2HHT 2HTH 2THH 1HTT 1THT 1TTH 0TTT
 0 1/8 1 3/8 2 3/8 3 1/8 Value of ΧOutcome 3HHH 2HHT 2HTH 2THH 1HTT 1THT 1TTH 0TTT")
25
12 3

26
The event F of obtaining at least two heads F = {HHH, HHT, HTH, THH} P(F) = 4/8 = ½ The same result can be obtained from the following reasoning: F is the event: “(X=2) or (X=3)” The probability of this event is equal to: p(X=2) + p(X=3) = the sum of the areas of the rectangles associated with the values 2 and 3 of the random variable = 1(3/8) + 1(1/8) = 4/8 = ½ on the following slide, these areas are identified (the shaded areas)
 = 4/8 = ½ The same result can be obtained from the following reasoning: F is the event: (X=2) or (X=3) The probability of this event is equal to: p(X=2) + p(X=3) = the sum of the areas of the rectangles associated with the values 2 and 3 of the random variable = 1(3/8) + 1(1/8) = 4/8 = ½ on the following slide, these areas are identified (the shaded areas)")
28
Expected Value of a Random Variable

29
Mean (Average) The average (mean) of the numbers a 1, a 2, a 3,……. a n is denoted by ā and equal to: (a 1 +a 2 +a 3 +…….+a n ) / n Example: Find the average of the following numbers: 5, 7, 9, 11, 13 Answer: The average of the given numbers ie equal to ( 5+7+9+11+13) / 5 = 45 / 5 = 9
 / n Example: Find the average of the following numbers: 5, 7, 9, 11, 13 Answer: The average of the given numbers ie equal to ( ) / 5 = 45 / 5 = 9.")
30
Expected Value of a Random Variable ( the average or the mean of the random variable) Let x be a random variable that assumes the values x 1, x 2, x 3,……. x n with associated probabilities p 1, p 2, p 3,……. p n respectively. Then the expected value of x denoted by E(x) is equal to x 1 p 1 + x 2 p 2 + x 3 p 3 +……+ x n p n
 is equal to x 1 p 1 + x 2 p 2 + x 3 p 3 +……+ x n p n.")
31
The the expected value of x ( the average or the mean of X) is a measure of central tendency of the probability distribution associated with X. As the number of the trails of an experiment gets larger and larger the values of x gets closer and closer to the expected value of x. Geometric Interpretation: Consider the histogram of the probability distribution associated with the random variable X. If a laminate (thin board or sheet) is made of this histogram, then the expected value of X corresponds to the point on the base of the laminate at which the laminate will balance perfectly when the point is directly over the a fulcrum (balancing object).
 is made of this histogram, then the expected value of X corresponds to the point on the base of the laminate at which the laminate will balance perfectly when the point is directly over the a fulcrum (balancing object)..")
33
Example (7) Let X be the random variable giving the sum of the dots on the faces that fall uppermost in the two dice rolling experiment. Find the expected value E(X) of X.
 of X..")
34
Recall the probability distribution of the this random variable P(X=x)x 1/362 2/363 3/364 4/365 5/366 6/367 5/368 4/369 3/3610 2/3611 1/3612
x 1/362 2/363 3/364 4/365 5/366 6/367 5/368 4/369 3/3610 2/3611 1/3612")
35
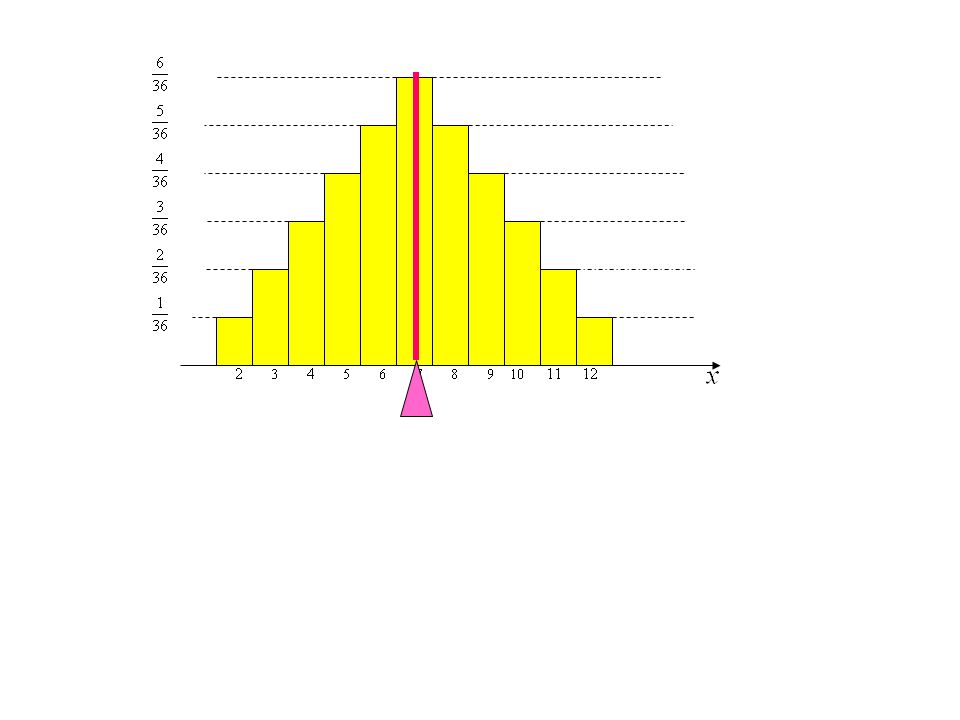
Solution E(X) = 2(1/36) + 3(2/36) + 4(3/36) + 5(4/36) + 6(5/36) + 7(6/36) + 8(5/36) + 9(4/36) + 10(3/36) + 11(2/36) + 12(1/36) =(2+6+12+20+30+42+40+36+30+22+12) / 36 = 252 / 36 = 7 Inspecting the histogram on the next slide, we notice that the symmetry of the histogram with respect to the vertical line x = 7, which is the expected value of the random variable X.
 = 2(1/36) + 3(2/36) + 4(3/36) + 5(4/36) + 6(5/36) + 7(6/36) + 8(5/36) + 9(4/36) + 10(3/36) + 11(2/36) + 12(1/36) =( ) / 36 = 252 / 36 = 7 Inspecting the histogram on the next slide, we notice that the symmetry of the histogram with respect to the vertical line x = 7, which is the expected value of the random variable X.")
37
Example (8) The occupancy rates with corresponding probability of hotels A (Which has 52 rooms) & B (which has 60 rooms) during the tourist season are given by the tables on the next slide. The average profit per day for each occupied room is QR 200 and QR 180 for hotels A & B respectively. Find: 1. The average number of rooms occupied per day in each hotel. 2. Which hotel generates the higher daily profit.

38
Hotel A Occupancy Rate Probability 0.80 0.19 0.85 0.22 0.90 0.31 0.95 0.23 1.00 0.05 Hotel B Occupancy Rate Probability 0.75 0.35 0.80 0.21 0.85 0.18 0.90 0.15 0.95 0.09 1.00 0.02

39
Steps I. For each hotel: 1. Find the expected value of the random variable defined to be the occupancy rate in the hotel. 2. Multiply that by the number of rooms of the hotel to find the average number of rooms occupied per day. 3. Multiply that by the profit made on each room per day to find the hotel daily profit. II. Compare the result of step 3., for hotels A & B.

40
Solution 1. Let the occupancy rate in Hotels A & B be the random numbers X & Y respectively. Then the average daily occupancy rate is given by the expected values E(X) and E(Y) of X and Y respectively. Thus: E(X) = (0.80)(0.19) + (0.85)(0.22) + (0.90)(0.31) + (0.95)(0.23) + (1.00)(0.05) ≈ 0.8865 The average number of rooms occupied per day in Hotel A = 0.8865 (52) ≈ 46.1 rooms E(Y) = (0.75)(0.35) + (0.80)().21) + (0.85)(0.18) + (0.90)(0.15) + (0.95)(0.09) + (1.00)(0.02) ≈ 0.8240 The average number of rooms occupied per day in Hotel A = 0.8240 (60) ≈ 49.4 rooms
 and E(Y) of X and Y respectively. Thus: E(X) = (0.80)(0.19) + (0.85)(0.22) + (0.90)(0.31) + (0.95)(0.23) + (1.00)(0.05) ≈ The average number of rooms occupied per day in Hotel A = (52) ≈ 46.1 rooms E(Y) = (0.75)(0.35) + (0.80)().21) + (0.85)(0.18) + (0.90)(0.15) + (0.95)(0.09) + (1.00)(0.02) ≈ The average number of rooms occupied per day in Hotel A = (60) ≈ 49.4 rooms.")
41
2. The expected daily profit at hotel A = (46.1 )(200) ≈ 9220 The expected daily profit at hotel B = (49.4 )(180) ≈ 8890 → hotel A generates a higher profit
(200) ≈ 9220 The expected daily profit at hotel B = (49.4 )(180) ≈ 8890 → hotel A generates a higher profit.")
Similar presentations

 : probability of element s of.>")

![Chapter 5 Probability Distributions. E.g., X is the number of heads obtained in 3 tosses of a coin. [X=0] = {TTT} [X=1] = {HTT, THT, TTH} [X=2] = {HHT,](/15/4547243/big_thumb.jpg "Chapter 5 Probability Distributions. E.g., X is the number of heads obtained in 3 tosses of a coin. [X=0] = {TTT} [X=1] = {HTT, THT, TTH} [X=2] = {HHT,>")


>= 0 for all x.>")

 Dr. Lari H. Arjomand>")

![Random Variables. A random variable X is a real valued function defined on the sample space, X : S R. The set { s S : X ( s ) [ a, b ] is an event}.](/25/7895386/big_thumb.jpg "Random Variables. A random variable X is a real valued function defined on the sample space, X : S R. The set { s S : X ( s ) [ a, b ] is an event}.>")


