Download presentation
Presentation is loading. Please wait.

1
CHAPTER 3 Graphical Presentations

2
Types of Variables l Qualitative - categories which can be named - Classification : Fr., So., Jr., Sr. - Occupation l Quantitative - “meaningful” numerical values - SAT score - Height, Weight, Age

3
Quantitative Variables may be discrete or continuous l Discrete - possible values for the variable can be listed - number of brothers - number of Heads out of 10 tosses of a coin l Continuous - different values can be arbitrarily close - height - weight

4
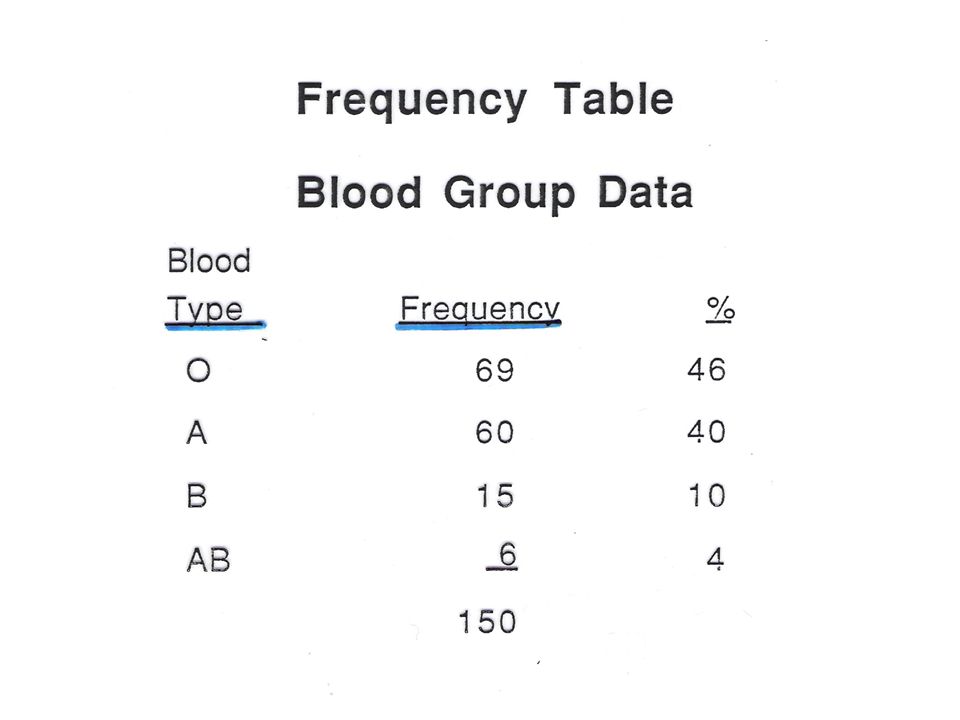
Blood Group Data – “raw data” Patient # Blood Type 1 O 2 A 3 A 4 O 5 B 6 O 7 A 8 AB..

6
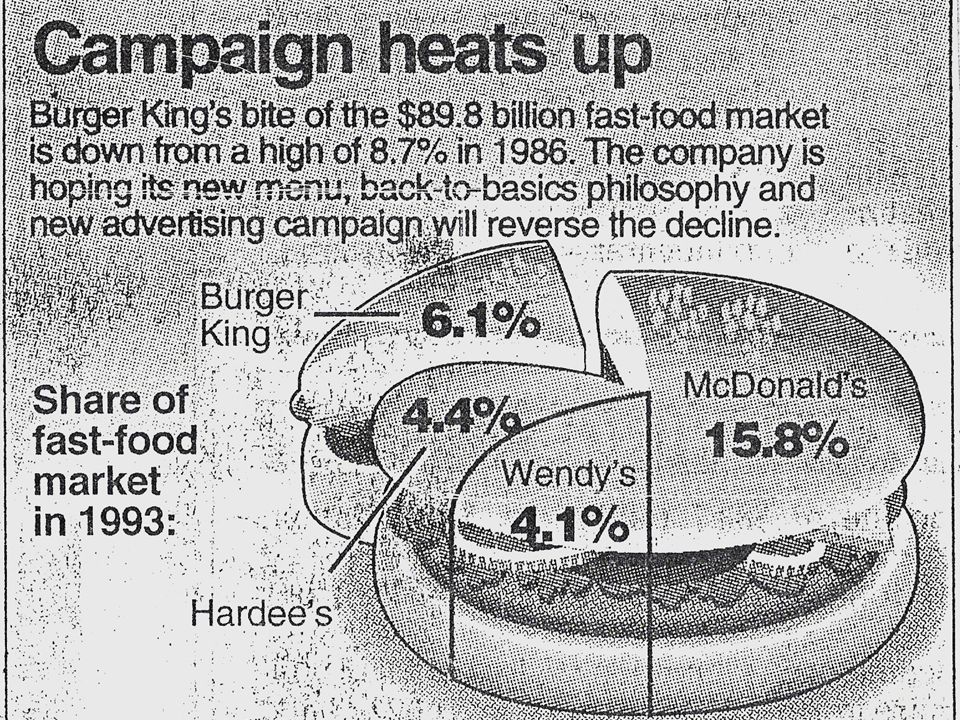
Pie Chart - Blood Group Data

8
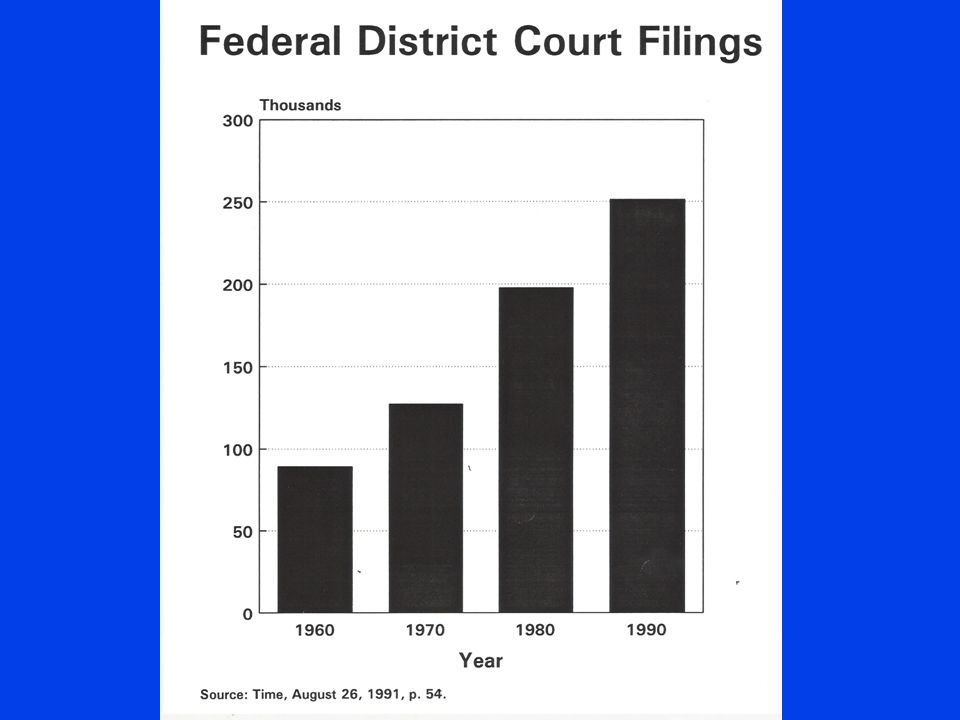
Bar Chart - Blood Group Data

12
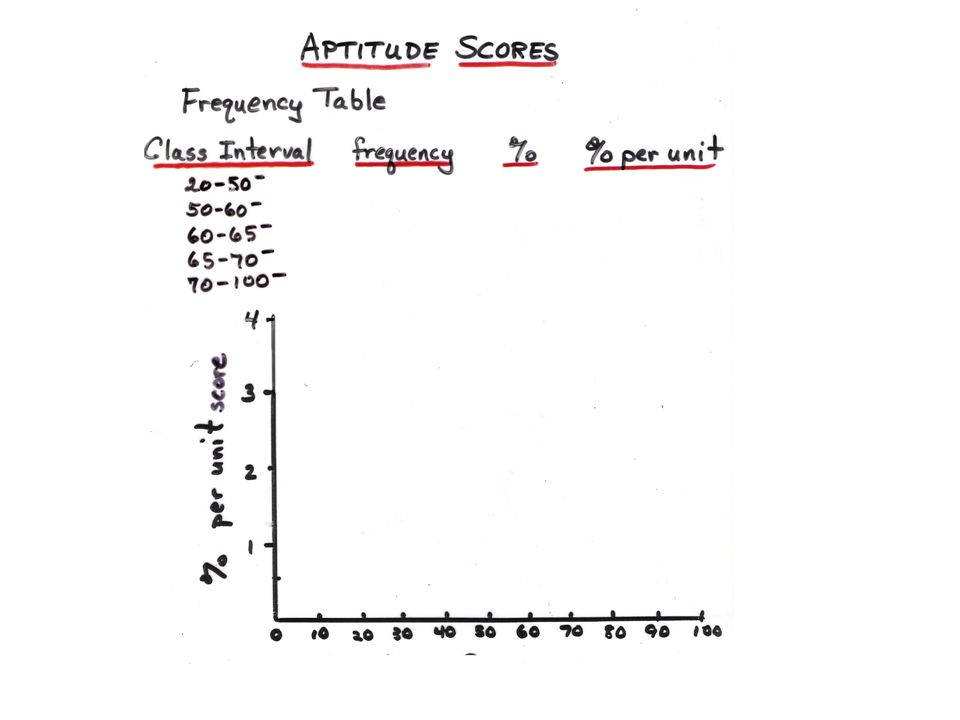
APTITUDE TEST scores for 20 applicants : Raw Data: 68, 72, 91, 47, 52, 75, 63 55, 65, 35, 84, 45, 58, 61 69, 22, 46, 55, 66, 71 Ordered List: 22, 35, 45, 46, 47, 52, 55 55, 58, 61, 63, 65, 66, 68 69, 71, 72, 75, 84, 91 Ways to Display Quantitative Data

13
Dot Plot for Aptitude Data Score

14
Stem-and-Leaf Diagram

15
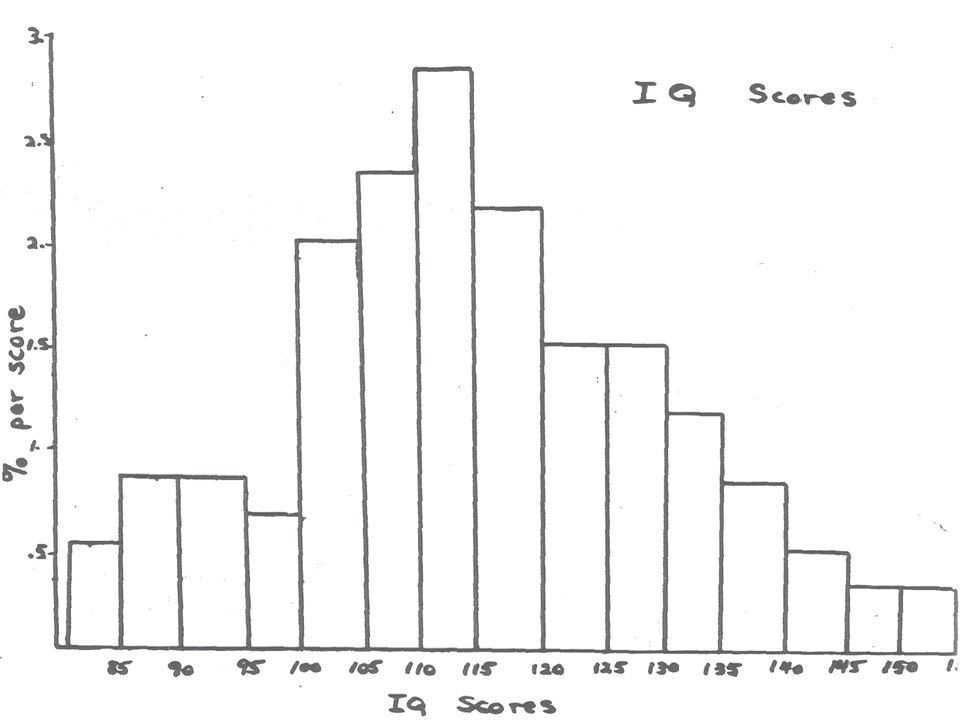
HISTOGRAM l for quantitative data l “sort of like” bar chart l represents % by area

20
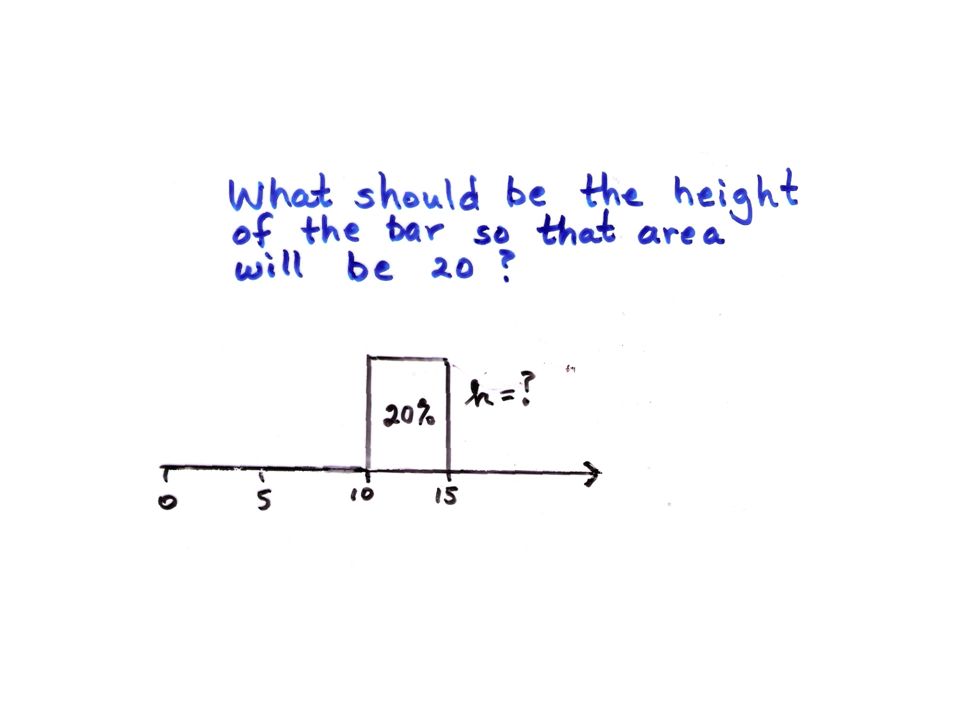
Density Scale % in that class interval Density Scale- sets height of block so that resulting area is % in that class interval % in class interval density scale ( % per unit) = length of class interval
 = length of class interval")
21
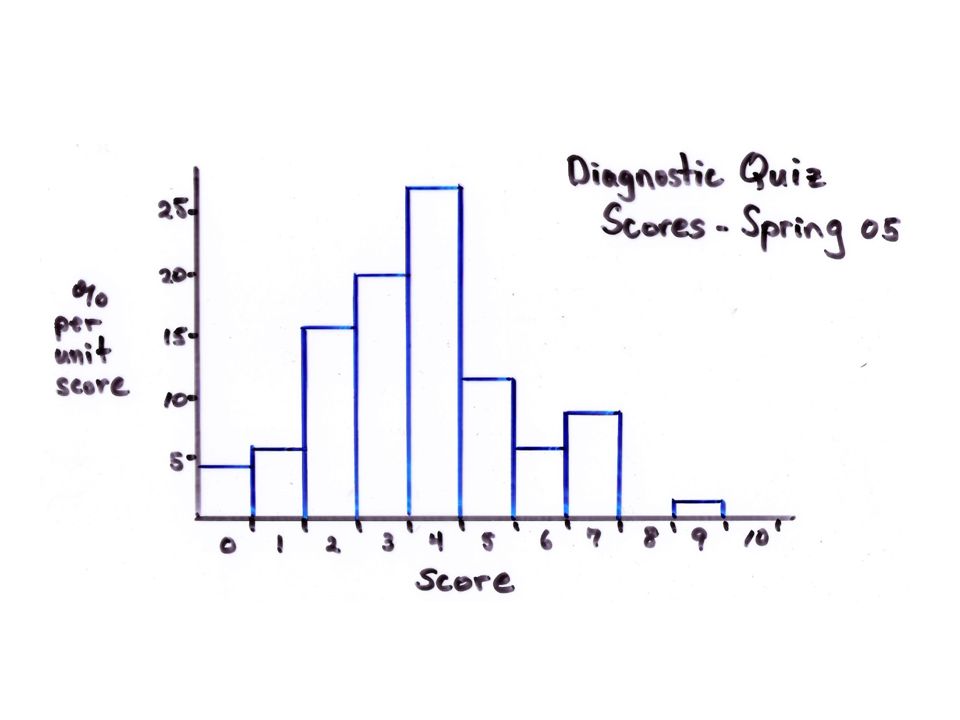
Summary HISTOGRAM -- for quantitative data -- represents % by area (use density scale) -- total area in blocks is 100% -- each histogram should have: - title - axes should be “numbered” and labeled BAR CHART -- for qualitative data -- represents % by height
 -- total area in blocks is 100% -- each histogram should have: - title - axes should be numbered and labeled BAR CHART -- for qualitative data -- represents % by height")
22
(what’s wrong with this histogram?) 4055 70 8095 20
")
Similar presentations


 Chapter 2 Presenting Data in Tables and Charts.>")


