Download presentation
Presentation is loading. Please wait.

1
Surface Area/Grain Size Relations Figure 2.2.8.1, page 31; Horowitz, A.J., 1991. A Primer on Sediment Trace Element Chemistry, 2 nd edition, Lewis Publishers, Chelsea, Michigan.

2
Forstner, U, and Witmann, GTW. Figure 39a and b. page 127. Metal Pollution in the Aquatic Environment; Springer Verlag, Berlin.

3
Changes in Surface Area as a Function of Grain Size Table from Horowitz, 1991; data from Jackson, 1979

4
Influence of Grain Mineralogy on Surface Area Table from Horowitz, 1991; data fromForstner and Wittmann, 1981

5
Influence of Coatings on Surface Area Sand-sized and Larger seds.: grain coatings composed of carbonates, Fe & Mn oxides and hydroxides, and organic matter are rough in comparison to surface of the underlying particles. –Coatings may comprise <5% by weight, but account for significant portion of the total surface area. Based on Horowitz and Elrick, 1987 Silt and clays sized particles: coatings fill in surface irregularities. Also, cement grains together, creating larger agglomerated grains. Combination of processes reduces surface area.

6
Grain Size vs. Concentration Semi-systematic increase in concentration with finer- grained material Forstner, U, and Witmann, GTW. Figure 36. page 123. Metal Pollution in the Aquatic Environment; Springer Verlag, Berlin. Decrease in conc. In finest fraction due to coatings, composition, and agglomeration of grains Increase in fine sand due to dentrital minerals. Also to influx of metal enriched sediments from pollutant sources.

7
Grain Size vs. Concentration Data from Forstner and Wittman, 1979

8
Concentration vs. Quantity of Fine Sediment Sizes Frequently Used 16 μm 62.5 μm 63 μm 125 μm Data from deGroot et al., 1982

9
Units of Concentration Concentrations (volume)Concentrations (weight) UnitSymbolsUnitSymbols moles per litermol/L or Mmoles per kgmol/kg millimoles per liter mmol/L or mM milliequavlents per kilogram meq/kg micromoles per liter µmol/L or µM micrograms per kg or ppbn µg/kg or ppb micrograms per liter µg/Lmilligrams per kg or parts per billion g/kg = ppm
Concentrations (weight) UnitSymbolsUnitSymbols moles per litermol/L or Mmoles per kgmol/kg millimoles per liter mmol/L or mM milliequavlents per kilogram meq/kg micromoles per liter µmol/L or µM micrograms per kg or ppbn µg/kg or ppb micrograms per liter µg/Lmilligrams per kg or parts per billion g/kg = ppm")
10
Metals per unit Mass Some deposits may contain so little fine- grained material that the bulk of the metal contaminant per unit mass is found in the sand-sized fraction.

12
Reservoir 0 1 1B 2 2B 3 4 5 6 7 7B 7C 7D 910 11 12 13 14 15 16 17 18 Gaging station Gaging Station Mineral Canyon Dayton Carson City Virginia City Table Mtn. Canyon (Brunswick) Fort Churchill 395 0 01234 12345 Miles Km 95 Six Mile Canyon Fan Gold Canyon S i x M i l e C a n y o n F o r k Carson City Carson River Watershed Boundary Carson Lake Carson Playa Stillwater Wildlife Refuge Lahontan Reservoir Lake Pyramid SIERRA NEVADA Nevada California F o r k E a s t T r u c k e e R. C a r s o n R. T r u c k e e R. W e s t F o r k C a r s o n R.. Lake Tahoe Lahontan
 Fort Churchill Miles Km 95 Six Mile Canyon Fan Gold Canyon S i x M i l e C a n y o n F o r k Carson City Carson River Watershed Boundary Carson Lake Carson Playa Stillwater Wildlife Refuge Lahontan Reservoir Lake Pyramid SIERRA NEVADA Nevada California F o r k E a s t T r u c k e e R. C a r s o n R. T r u c k e e R. W e s t F o r k C a r s o n R.. Lake Tahoe Lahontan.")
14
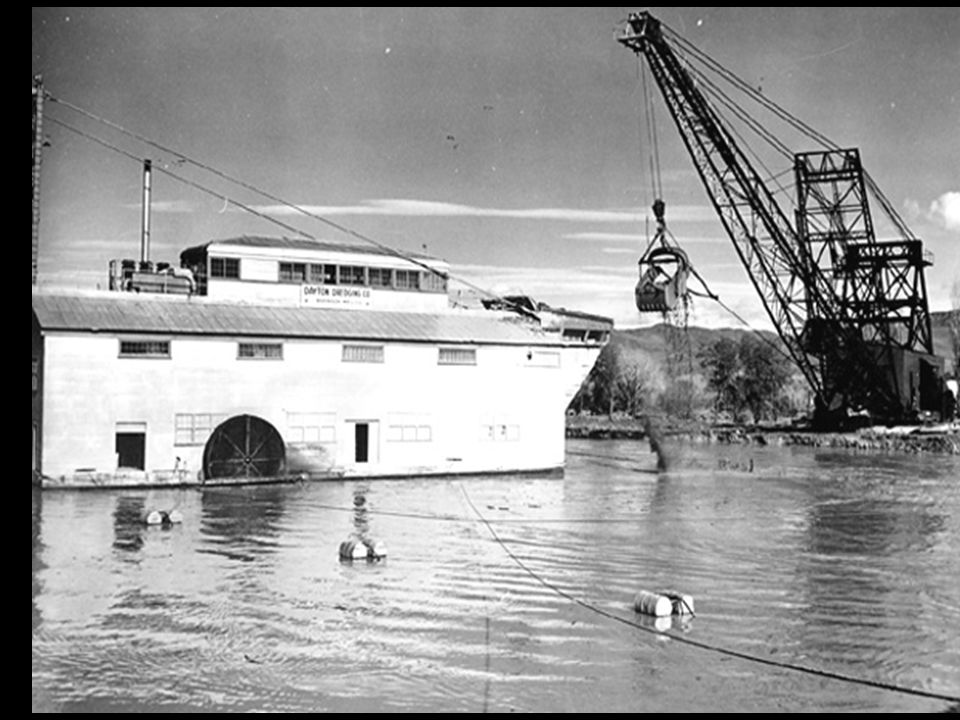
Eureka Mill, Brunswick Canyon

15
Reservoir 0 1 1B 2 2B 3 4 5 6 7 7B 7C 7D 910 11 12 13 14 15 16 17 18 Gaging station Gaging Station Mineral Canyon Dayton Carson City Virginia City Table Mtn. Canyon (Brunswick) Fort Churchill 395 0 01234 12345 Miles Km 95 Six Mile Canyon Fan Gold Canyon S i x M i l e C a n y o n F o r k Carson City Carson River Watershed Boundary Carson Lake Carson Playa Stillwater Wildlife Refuge Lahontan Reservoir Lake Pyramid SIERRA NEVADA Nevada California F o r k E a s t T r u c k e e R. C a r s o n R. T r u c k e e R. W e s t F o r k C a r s o n R.. Lake Tahoe Lahontan
 Fort Churchill Miles Km 95 Six Mile Canyon Fan Gold Canyon S i x M i l e C a n y o n F o r k Carson City Carson River Watershed Boundary Carson Lake Carson Playa Stillwater Wildlife Refuge Lahontan Reservoir Lake Pyramid SIERRA NEVADA Nevada California F o r k E a s t T r u c k e e R. C a r s o n R. T r u c k e e R. W e s t F o r k C a r s o n R.. Lake Tahoe Lahontan.")
18
Fractional Contributions of Selected Metals in Suspended Sediments Concentration Percent Contribution Constituent (mg/kg) <63 μm fraction >63 μm fraction Total Sample <63 μm fraction >63 μm fraction Arkansas River (sampled 5/11/87) a,b Mn110060080050 Cu5122335842 Zn3251101906337 Pb5225355446 Cr5644494357 Ni3216225545 Co151112.54555 Cowlitz River (sampled 4/20/87) a,c Mn6506706604060 Cu6333465743 Zn6268594258 Pb121010.84555 Cr3519255644 Ni2516195347 Co14 4159 a The represents the mean of the initial and final composite samples obtained at these sampling sites. b 63 μm fraction equaled 63 %, c 63 μm equaled 59 %. (modified from Horowitz et al., 1990)
.")
Similar presentations


 = moles of solute liter of solution Dilutions: M 1 x V 1 = M 2 x V 2 Percent by volume.>")


 in sediment Gives information on: 1.Background levels of contamination.>")


, P. O. Box 8402, University Road, Karachi-75270, Pakistan.>")