Download presentation
Presentation is loading. Please wait.

1
Summarizing Quantitative Data

2
We have discussed how to display data in a histogram. Today learn to describe how data is distributed.

3
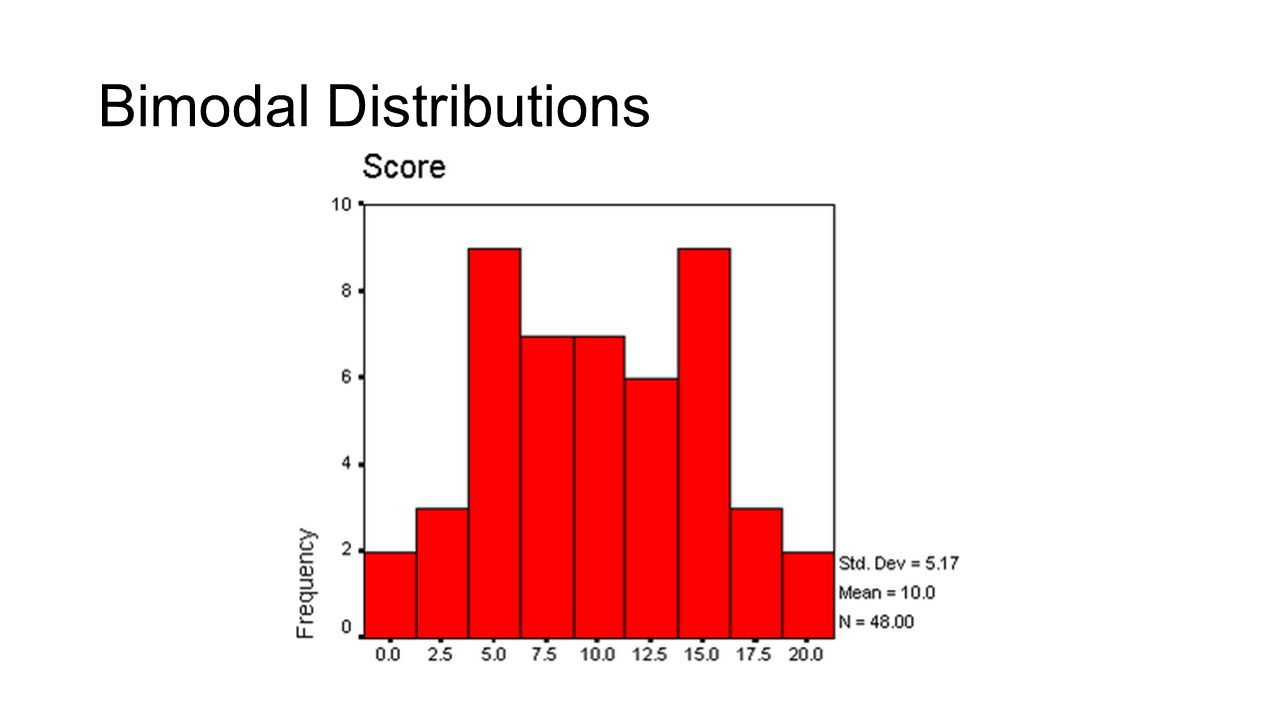
Symmetric Distributions U –Shaped Distributions or Bimodal Distribution Peaks at either end of the range.

4
Bimodal Distributions

6
Bimodal Distribution

7
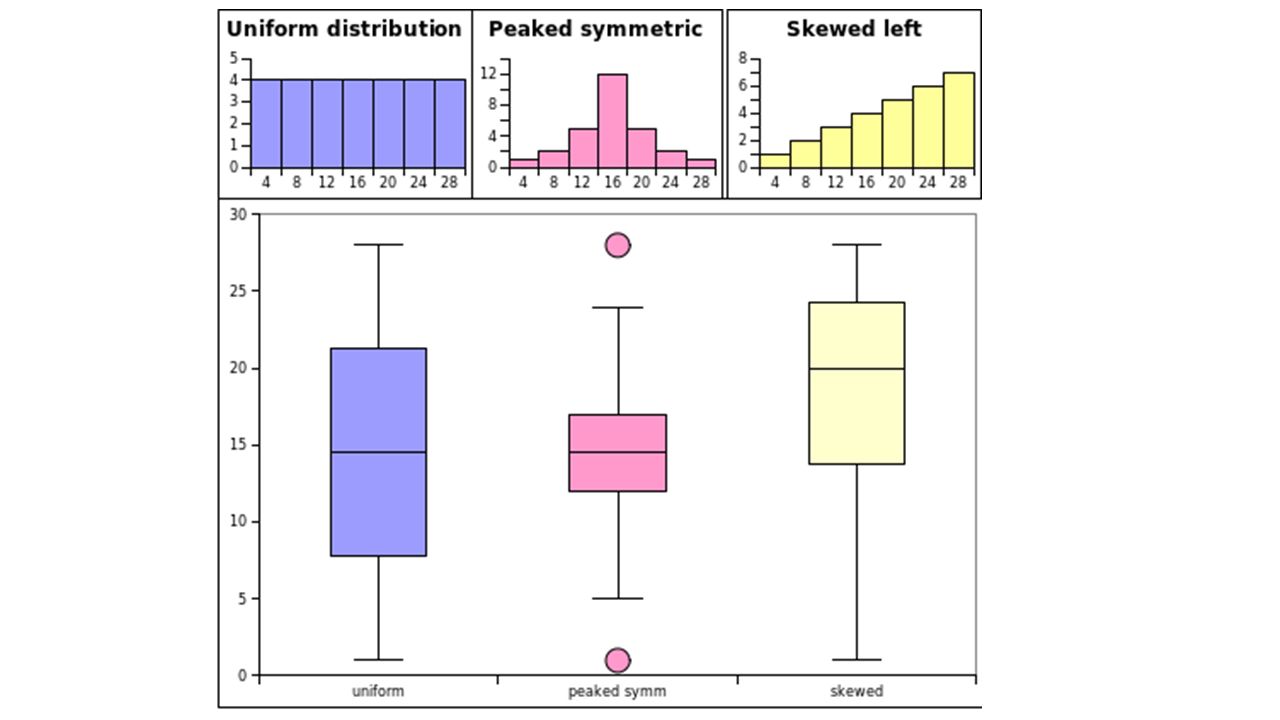
Uniform Distribution When each outcome has a similar frequency it is called a uniform distribution. Most common occurrence is in situations with total randomness.

8
Uniform Distribution

9
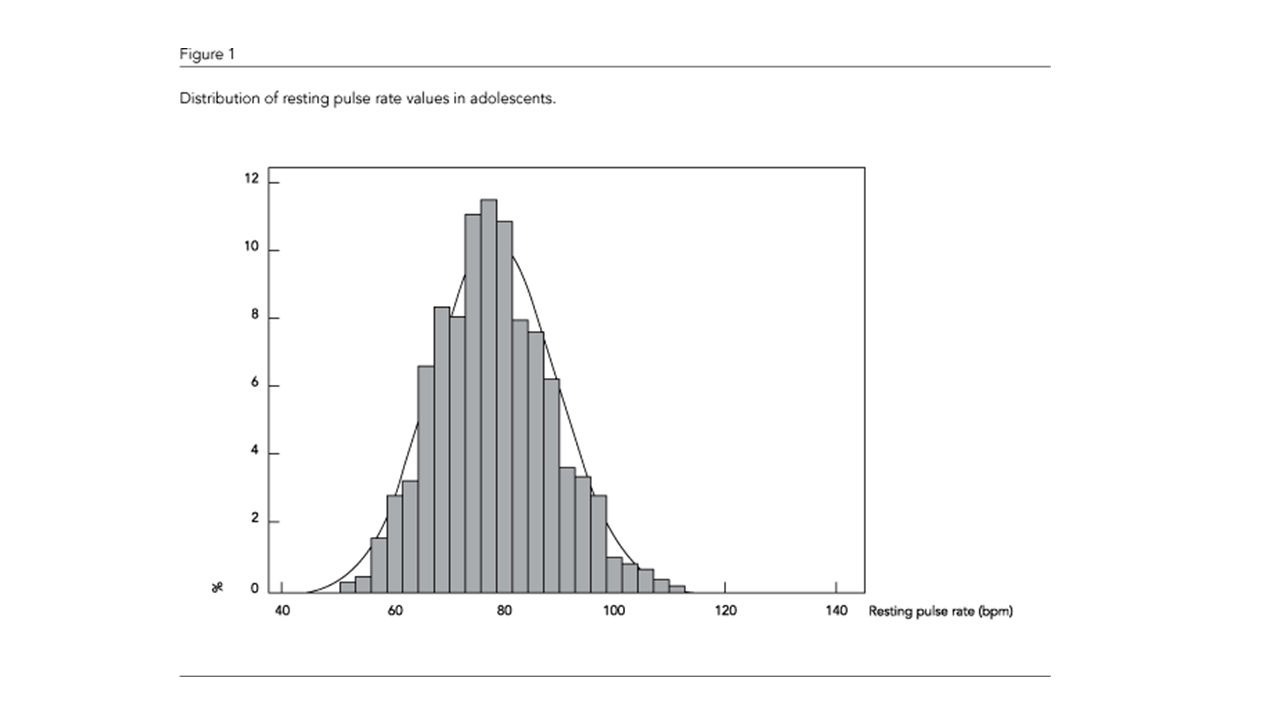
Normal Distribution Mound shape or “Bell Curve” Distribution found in MANY applications in Science, commerce, industry, etc. Blood Pressure, heart rates, height of adult males, weights of 2 year old girls, test scores, etc.

10
Normal Distribution

12
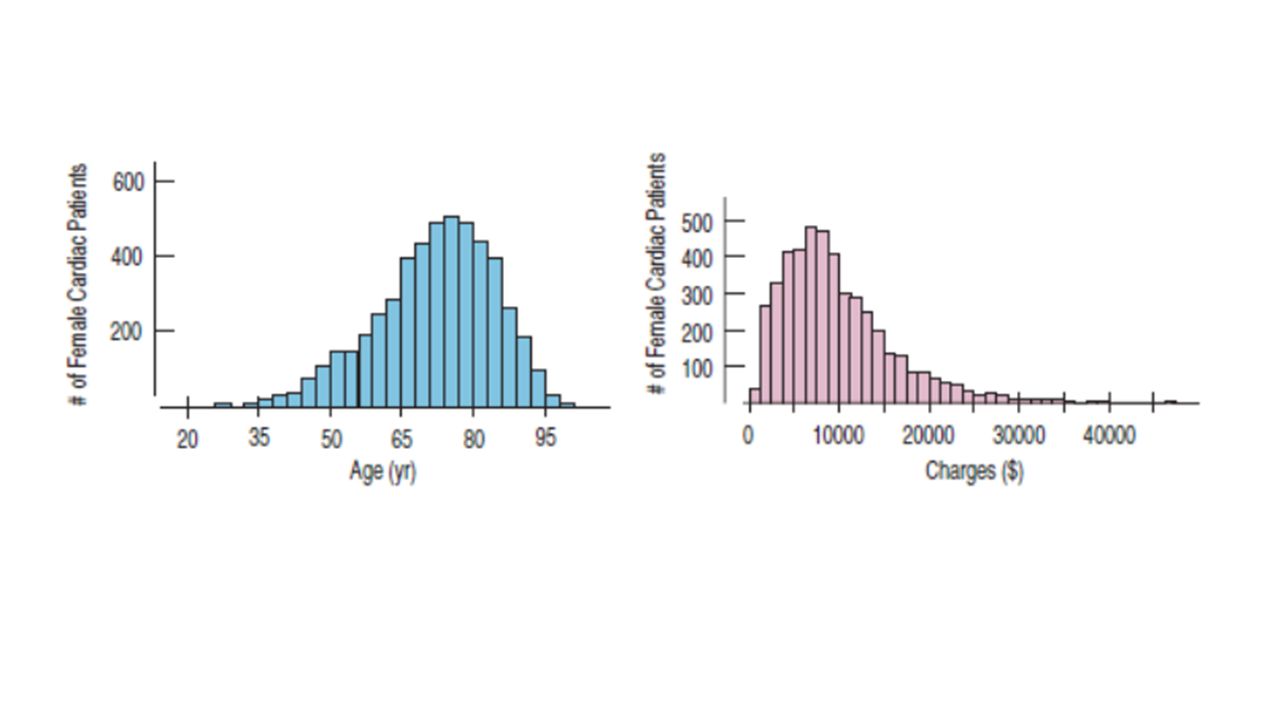
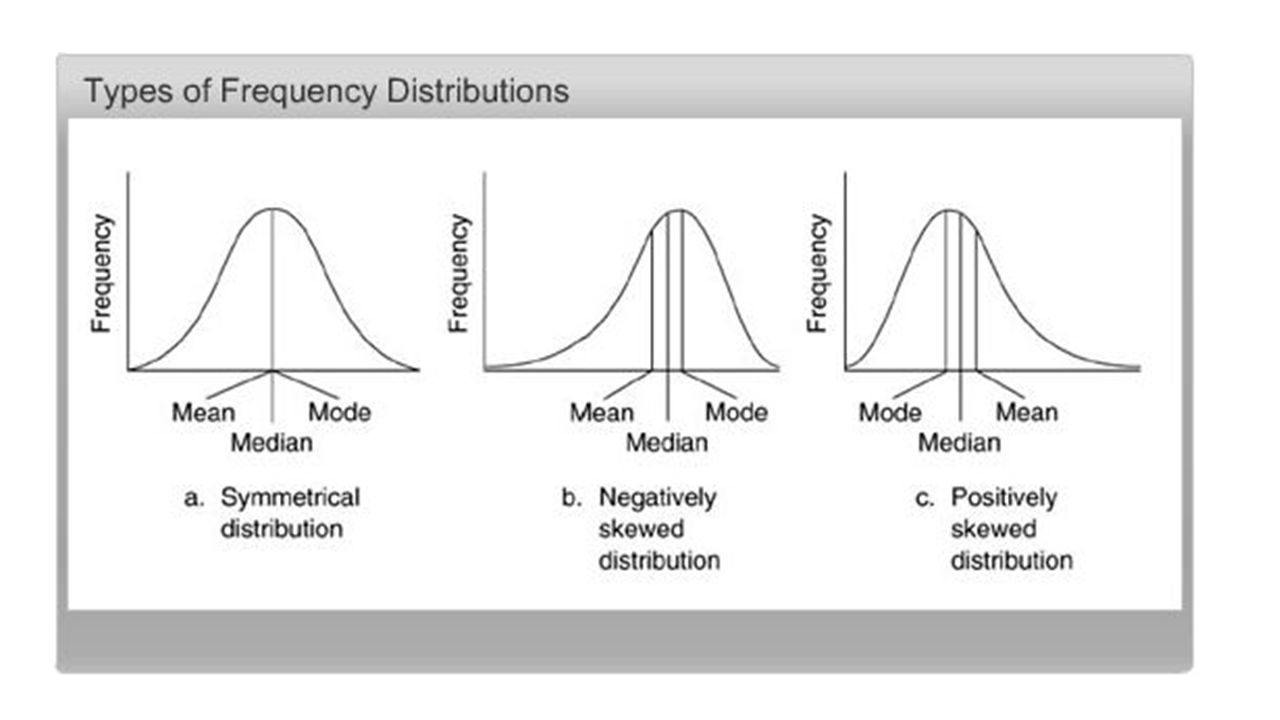
Skewed Distributions In a skewed distribution, the interval or group of intervals that contains the greatest frequencies is near one end of the histogram The thinner ends of the distribution are called the tails If one tail stretches out farther than the other, the histogram is said to be skewed to the side of the longer tail

16
Summarizing Data Step 1: Identify the variable you are summarizing and give any pertinent information Step 2: Make a histogram and a box-and-whisker plot Step 3: Based on the distribution of the data, choose appropriate numerical summaries Step 4: Summarize and interpret your findings. Discuss the shape of the distribution, center, spread and any unusual features (eg. Outliers)
.")
17
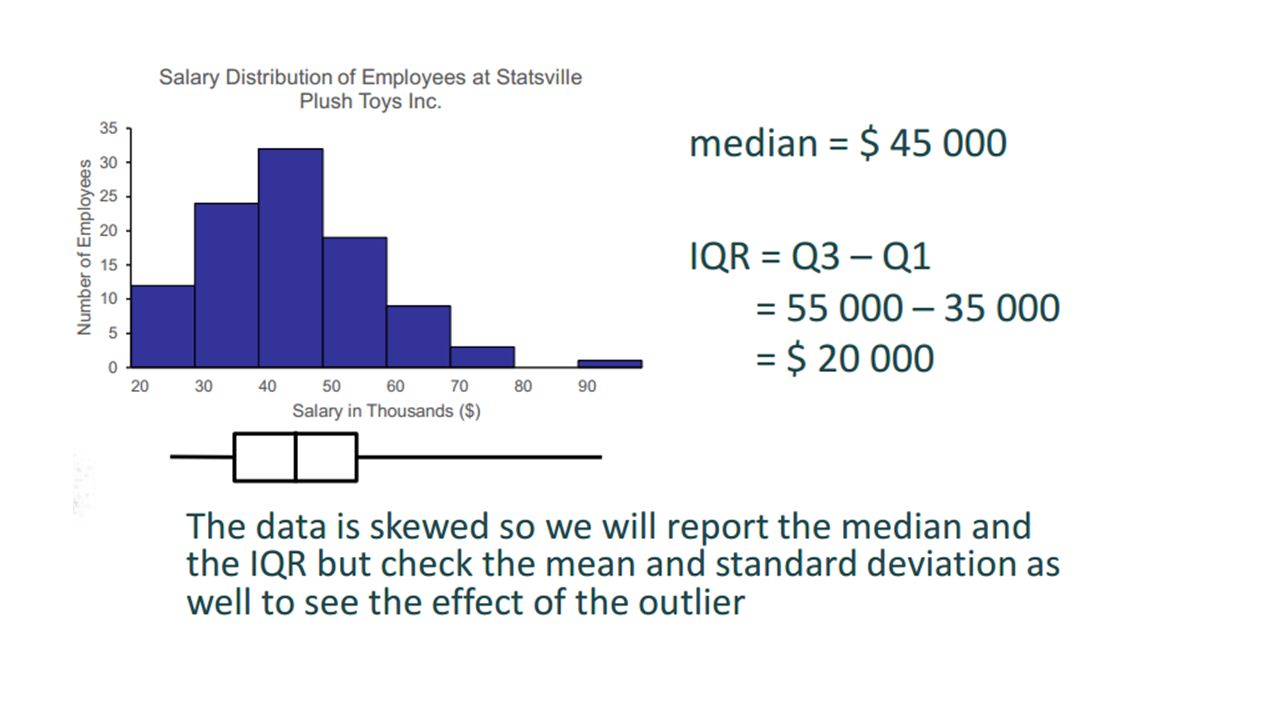
Example Summarize the distribution of the following data on the salary structure of Statsville Plush Toys Inc.

18
Step 1 Identify Variable Step 1: Identify the variable you are summarizing and give any pertinent information The Data Describes the salaries of all 100 employees at Statsville toy companies

19
Step 2 Make Histogram; Box and Whisker Median: 50 th and 51 entry are here 3 rd Quartile: 75 th and 76 th entry are here 1 st Quartile: 25 th and 26 th entry are here

20
Step 2 Make Histogram; Box and Whisker

21
Step 3 Pick Appropriate Numerical Summaries Centre and Spread Always pair the median with the IQR and the mean with the standard deviation If the distribution is skewed, report the median and the IQR. You may wish to point out the mean and standard deviation as well, but point out why the mean and median differ If the distribution is symmetric, report the mean and standard deviation

22
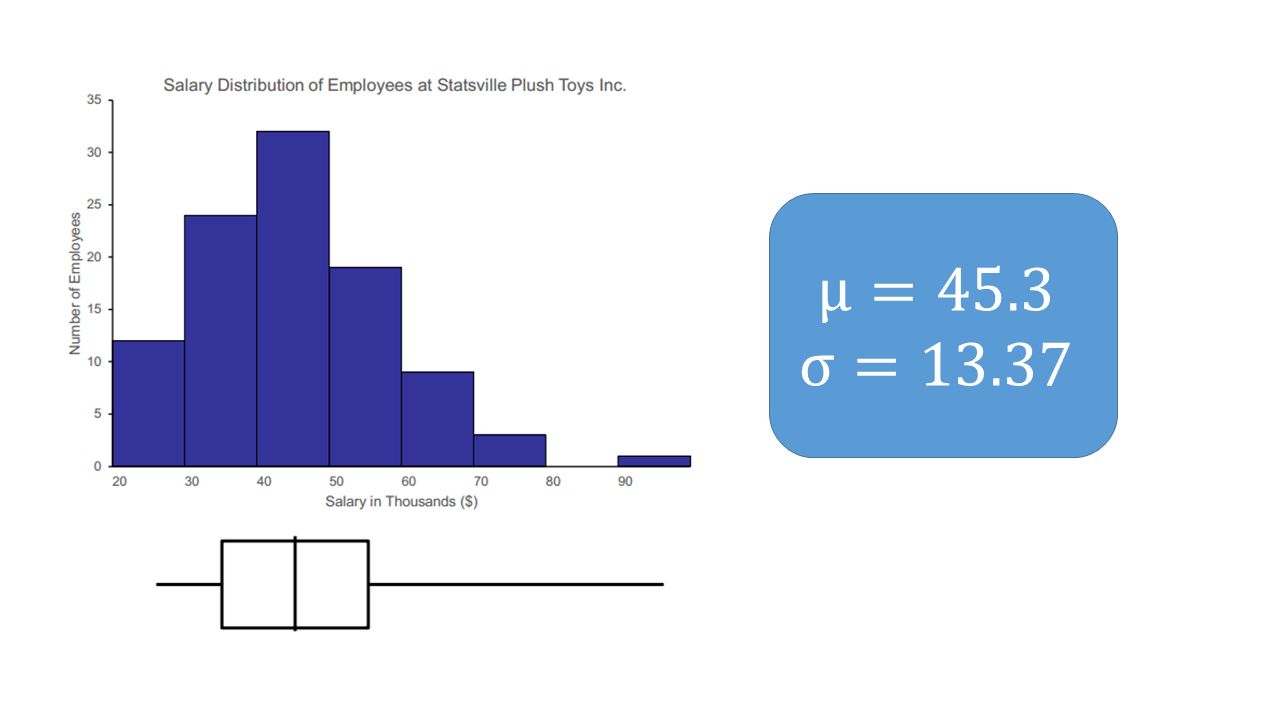
Step 3 Pick Appropriate Numerical Summaries Unusual Features If there are multiple modes, try to identify why If there are clear outliers, point them out. If you are reporting mean and standard deviation, report them with outliers present and with outliers removed (median and IQR not affected much by outliers)
.")
25
Step 4 Summarize and interpret The data is unimodal and somewhat right-skewed with a median of $ 45 000 and IQR of $ 20 000 indicating that the spread of employee salaries at Statsville Plush Toys Inc. is fairly high There was a high outlier of $ 95 000. In this case the outlier did not have a significant effect on the mean of $ 45 300 From the standard deviation it can be concluded that on average, employee salaries differ from the mean by $ 13 380

26
Assignment Handout

Similar presentations


 Then count the number of values.>")


>")


