Download presentation
Presentation is loading. Please wait.

1
ISCCP at its 30 th (New York, 22 – 25 April, 2013) Congratulations to the “Core Team” and to “Patient Outside-Supporters”: Our best wishes for a perspective future and for a continuing stream of..s each day! ? The true “New York Style” bagel

2
A few Aspects of Cloud Impact on the Radiation Budget … by “satellite observations” and … by model simulations Ehrhard Raschke 1 and Stefan Kinne MPI Meteorology & ( 1 ) U. of Hamburg, Germany ISCCP at its 30 th, New York, 22 – 25 April, 2013 (Influence of clouds on the radiation budget of the atmosphere and at its boundaries estimated with satellite-based and model data sets) ? Further reading: E. Raschke, S. Kinne, P. Stackhouse Jr. et al., WCRP Report 19/2012, >500 pp, >150 MB
 . Further reading: E. Raschke, S. Kinne, P. Stackhouse Jr. et al., WCRP Report 19/2012, >500 pp, >150 MB.")
3
Classical Questions: How & where do clouds modulate the transfer of radiative energy within the Earth- Atmosphere-System ? How well are clouds observed and modeled? We know now many details qualitatively on the CRE. But can we rely on this state to justify climate variations as they might be manifested in variations of cloud and radiation fields?

4
Our tools: Two data sets Based on Observations: Central value: {CERES, ISCCP, SRB} average [CIS] Uncertainty: {CERES, ISCCP, SRB} local spread* [ΔCIS] period 4 years (03/2000-02/2004) Models of IPCC-4 Central value: Interquartile average [IPCC] Uncertainty: Interquartile spread range* [ΔIPCC] period 12 years (1984-1995) * means deseasonalized
![Our tools: Two data sets Based on Observations: Central value: {CERES, ISCCP, SRB} average [CIS] Uncertainty: {CERES, ISCCP, SRB} local spread* [ΔCIS] period 4 years (03/ /2004) Models of IPCC-4 Central value: Interquartile average [IPCC] Uncertainty: Interquartile spread range* [ΔIPCC] period 12 years ( ) * means deseasonalized](http://images.slideplayer.com/26/8415335/slides/slide_4.jpg "Our tools: Two data sets Based on Observations: Central value: {CERES, ISCCP, SRB} average [CIS] Uncertainty: {CERES, ISCCP, SRB} local spread* [ΔCIS] period 4 years (03/ /2004) Models of IPCC-4 Central value: Interquartile average [IPCC] Uncertainty: Interquartile spread range* [ΔIPCC] period 12 years ( ) * means deseasonalized")
5
all-sky CIS S=342 IPCC CMIP 3 S=342 Trenberth 2007 S=342 Stephens 2012 S=340 Wild 2013 S=340 TOA total net+ 2.5+ 2000 SW up at TOA- 101- 102 - 100 LW up at TOA- 238- 235- 239- 240- 239 IR-GHE154157 158 SW dn at sfc190187184188185 SW up at sfc- 25- 24- 23 - 24 LW dn at sfc344334333345342 LW up at sfc- 394- 393- 396- 398- 397 SW net at sfc165163161165161 LW net at sfc- 50- 59- 63- 53- 55 Tot net at sfc11510498 112 106 SW div in atm7675797579 LW div in atm- 188- 176 - 187- 185 Total div in atm- 112- 101- 97- 112- 106 Annual global averages of CIS, IPCC and other datasets for all-sky conditions (in Wm -2 ) Rounding errors: > ± 0.5 Wm -2
 Rounding errors: > ± 0.5 Wm -2")
6
Net at TOA CRE of Net at TOA CIS: Net and CRE on Net radiation at TOA (4 years)
")
7
Net Radiation CRE of Net Radiation CIS: Net and CRE on Net Radiation at Surface (4 years)
")
8
IPCC minus CIS (in Wm -2 ) at TOA Annual all-sky netflux at TOA c 0 Annual CRE on netflux at TOA 1
 at TOA Annual all-sky netflux at TOA c 0 Annual CRE on netflux at TOA 1")
9
IPCC minus CIS (in Wm -2 ) at surfacec -11 -12 Annual CRE on netflux at surface Annual all-sky netflux at surface
 at surfacec Annual CRE on netflux at surface Annual all-sky netflux at surface")
10
Relative spread ranges: 100x(ΔIPCC - ΔCIS) / ΔCIS TOA: diversity is much larger in modeling Surface: mixed message
 / ΔCIS TOA: diversity is much larger in modeling Surface: mixed message")
11
Major reasons for disagreement: 1.Clouds: optical depth, vertical distribution – both “measured” and modeled. 2.Ancillary data, which describe the state of the atmosphere and ground. Aerosols, GH- gases, the temperature and also the insolation at TOA are ancillary; also the reflectance and temperature of the surface. 3.Errors in computational procedures

12
CIS average ΔCIS (spread) SW surface albedo LW, up flux / 600 Wm -2 CIS: Ancillary data of surface are quite uncertain
 SW surface albedo LW, up flux / 600 Wm -2 CIS: Ancillary data of surface are quite uncertain")
13
Total divergence and LW Greenhouse-E.

14
CIS: Total divergence and greenhouse Clouds increase and decrease total divergence and contribute up to 25% of local GHE LW greenhouse effectSW+LW divergence CRE + + + + - + +

15
CIS: Spread of divergence and GHE Local spread of CRE ~ 20 to 40% of local flux CRE all-sky avg SW+LW divergenceLW greenhouse effect CRE

16
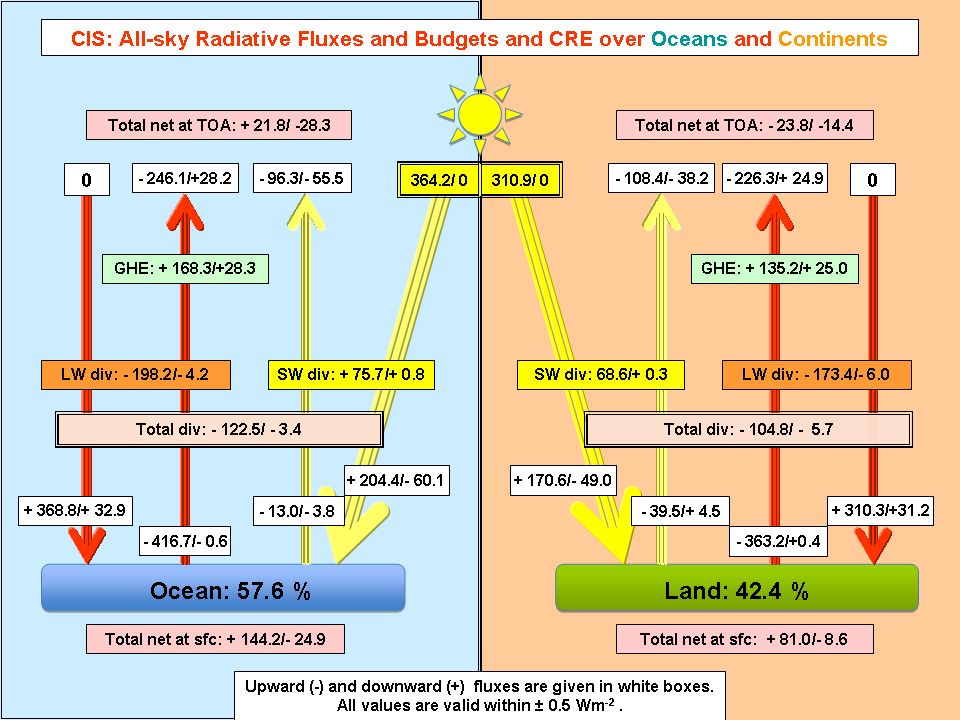
Are there typical differences between radiation fields over “deep ocean regions” and over “land surfaces” ?

18
All-skyClear skyCloud radiative effects CISIPCCCISIPCCCISIPCC ocean S=364 land S=311 ocean S=364 land S=311 ocean S=364 land S=311 ocean S=364 land S=311 ocean S=364 land S=310 ocean S=364 land S=311 TOA total net 0.06- 0.080.06- 0.070.14- 0.030.13- 0.04- 0.09- 0.05- 0.07- 0.04 SWup at TOA 0.260.350.280.350.110.220.110.230.150.130.160.12 LWup at TOA 0.680.730.670.720.750.810.750.80- 0.08 IR-GHE at TOA 0.470.44 0.480.430.390.360.390.370.08 0.090.06 SWdn at sfc 0.560.550.540.560.730.710.74 - 0.17- 0.16- 0.20- 0.17 SWup at sfc 0.030.150.04 0.140.03 0.15 0.040.15- 0.01- 0.00 - 0.01 LWdn at sfc 1.011.000.990.950.920.900.910.860.090.100.09 LWup at sfc 1.141.171.15 1.141.171.141.170.00 -0.02 SWnet at sfc 0.540.400.500.420.700.560.700.58- 0.15- 0.16- 0.20- 0.16 LWnet at sfc - 0.13- 0.17- 0.16- 0.20- 0.22- 0.27- 0.24- 0.31- 0.09- 0.100.080.11 Totnet at sfc 0.40 0.230.350.22 0.470.290.460.28- 0.07- 0.06- 0.11- 0.05 SWdiv in atm 0.210.220.230.220.210.220.20 0.00 0.040.02 LWdiv in atm - 0.54- 0.56- 0.54- 0.56- 0.53- 0.54- 0.52 - 0.01- 0.02 - 0.04 Total div in atm - 0.33- 0.34- 0.31- 0.34- 0.32 - 0.01- 0.020.02- 0.02 Radiation products scaled vs. insolation at TOA

19
Summary and recommendations 1.Clouds reduce (enhance) downward SW and upward LW (upward SW and downward LW) radiation. CRE on net fluxes and on divergences are mixed depending on cloud top height and wavelength. 2.Uncertainties and diversities are often higher in IPCC than in CIS data. They are caused by uncertainties in ancillary data and in cloud treatment. 3.Specific problems occur over mountainous continental and over both sub-arctic regions (What is the radiation budget of a grid element over the Andes?). ------------------------------------------------- We recommend to re-analyze all datasets and to agree on same properties for the surface albedo and emission! We encourage for international competition! Apply unique and stringent quality control procedures! Plan careful for next radiation assessment with more recent data.
 We recommend to re-analyze all datasets and to agree on same properties for the surface albedo and emission. We encourage for international competition. Apply unique and stringent quality control procedures. Plan careful for next radiation assessment with more recent data..")
20
Thank You! Further reading: E. Raschke, S. Kinne, P. Stackhouse Jr. et al., WCRP Report 19/2012, > 500 pp, > 150 MB.

21
SW & LW divergence & GHE

22
CIS: Mixed messages for atm. CRE CRE on SW divergence in the atmosphere CIS: Is it correct? ISCCP: Clouds increase solar absorption in atm SRB: Clouds increase solar absorption in atm … over oceans CERES: Clouds decrease solar absorption in atm …

23
TOA Surface IPCC minus CIS of net fluxes at CREAll-sky net flux TOA : CRE difference dominate all-sky difference Surface: CIS CRE are much weaker (trop oceans)
")
24
IPCC minus CIS of SW-div, LW-div, LW-GHE All-sky Clear-sky CRE

25
ΔIPCC minus ΔCIS of SW-div, LW-div, LW-GHE All-sky Clear-sky CRE

26
CIS Annual net flux at TOA Annual net flux at surface

27
Clouds reduce the annual net flux at TOA and surface. CIS-CRE CRE on net flux at TOA CRE on net flux at surface

28
CIS average ΔCIS spread CRE on SW, dn CRE on LW, dn CIS: CRE of down fluxes and their uncertainty at surface

Similar presentations

 Stefan Kinne (Hamburg) Yoko Tsuschima (Yokohama) Stephan Bakan (Hamburg) With data contributions.>")


>")


 and.>")


