Download presentation
Presentation is loading. Please wait.

1
Speaker: Bin-Shenq Ho Dec. 19, 2011
Inadequacies of Minimum Spanning Trees in Molecular Epidemiology Stephen J. Salipante and Barry G. Hall JOURNAL OF CLINICAL MICROBIOLOGY, Oct. 2011, p. 3568–3575 Speaker: Bin-Shenq Ho Dec. 19, 2011

2
Sep. 22, 2010

3
Underlying Reasoning How will be the representativeness of a single, arbitrarily selected MST in terms of potentially many equally optimal solutions How could be the role of statistical metrics in the credibility of MST estimations Equally parsimonious paths if two or more edges have the same lengths Better considered a MSN To infer population structure, statistical methods are employed to gauze the credibility of inferences. Common techniques for assessing the statistical robutness of population structure estimations include bootstrapping and the use of Bayesian posterior probabilities. To implement a bootstrapping metric to evaluate the credibility of alternative MST solutions To implement a systemic approach to MST estimation, through bootstrapping metric

4
MST gold http://www.bellinghamresearchinstitute.com
Materials and Methods MST gold Max amount of time Max number of unique MSTs Min rate of new discovery

5
Distance matrix calculation
Materials and Methods Distance matrix calculation Equidistant method sequence, spoligotype, SNP Difference method VNTR

6
spacer oligonucleotide type
spoligotype spacer oligonucleotide type The genome size of the M. tuberculosis H37Rv strain is around 4 million base pairs with 3959 genes. Spacer oligonucleotide typing is a hybridization assay that detects variability in the direct repeat (DR) region in the DNA of M. tuberculosis. The DR region consists of multiple copies of a conserved 36-base-pair sequence (the direct repeats) separated by multiple unique spacer sequences (the standard spoligotyping assay uses 43). Different M. tuberculosis strains have various complements of the 43 spacers, and these different complements form the basis of the assay (Kamerbeek 1997). The standard spoligotyping assay is performed by using a membrane. In this format, each of the 43 spacers produces either a dark band (indicating the presence of the spacer) or no band (indicating the spacer’s absence). As Figure 3.1 shows, for each M. tuberculosis isolate, the spoligotyping assay produces a series of bands, much like a bar code. ( (
 region in the DNA of M. tuberculosis. The DR region consists of multiple copies of a conserved 36-base-pair sequence (the direct repeats) separated by multiple unique spacer sequences (the standard spoligotyping assay uses 43). Different M. tuberculosis strains have various complements of the 43 spacers, and these different complements form the basis of the assay (Kamerbeek 1997). The standard spoligotyping assay is performed by using a membrane. In this format, each of the 43 spacers produces either a dark band (indicating the presence of the spacer) or no band (indicating the spacer’s absence). As Figure 3.1 shows, for each M. tuberculosis isolate, the spoligotyping assay produces a series of bands, much like a bar code. ( (")
7
variable number of tandem repeat
VNTR variable number of tandem repeat Variable number of tandem repeat (VNTR) typing is based on analysis of DNA segments containing “tandem repeated” sequences in which the number of copies of the repeated sequence varies among strains. The method relies on PCR amplification and calculation of the number of repeats on the basis of the size of the amplified product. MIRUs are a class of tandem repeated sequences. There are a total of 41 MIRU loci, of which 12 have been selected for genotyping. The names of the 12 loci that will be analyzed are 02, 04, 10, 16, 20, 23, 24, 26, 27, 31, 39, and 40 (Mazars 2001). MIRU results are reported as 12-character designations, each character corresponding to the number of repeats at one of the 12 MIRU loci, listed in a standard order (Table 3.1). In rare instances, the number of repeats is greater than 9. To avoid the use of double digits, the following designations are used in reporting results: 10 repeats = “a”; 11 repeats = “b”; 12 repeats = “c”; etc. Occasionally, the repeat number is 0. If the region is deleted and no amplification product is obtained, this is indicated by a dash (-). A few strains give an anomalous result for MIRU locus number 04 (i.e., the second digit in the MIRU type). These anomalous results at 04 are designated “x,” “y,” or “z,” depending on the number of repeats. ( (
 typing is based on analysis of DNA segments containing tandem repeated sequences in which the number of copies of the repeated sequence varies among strains. The method relies on PCR amplification and calculation of the number of repeats on the basis of the size of the amplified product. MIRUs are a class of tandem repeated sequences. There are a total of 41 MIRU loci, of which 12 have been selected for genotyping. The names of the 12 loci that will be analyzed are 02, 04, 10, 16, 20, 23, 24, 26, 27, 31, 39, and 40 (Mazars 2001). MIRU results are reported as 12-character designations, each character corresponding to the number of repeats at one of the 12 MIRU loci, listed in a standard order (Table 3.1). In rare instances, the number of repeats is greater than 9. To avoid the use of double digits, the following designations are used in reporting results: 10 repeats = a ; 11 repeats = b ; 12 repeats = c ; etc. Occasionally, the repeat number is 0. If the region is deleted and no amplification product is obtained, this is indicated by a dash (-). A few strains give an anomalous result for MIRU locus number 04 (i.e., the second digit in the MIRU type). These anomalous results at 04 are designated x, y, or z, depending on the number of repeats. ( (")
8
multilocus sequence type
MLST multilocus sequence type The procedure characterizes isolates of bacterial species using the DNA sequences of internal fragments of multiple housekeeping genes. For each housekeeping gene, the different sequences present within a bacterial species are assigned as distinct alleles and, for each isolate, the alleles at each of the loci define the allelic profile or sequence type (ST). Nucleotide differences between strains can be checked at a variable number of genes depending on the degree of discrimination desired. Approximately bp internal fragments of each gene are used, as these can be accurately sequenced on both strands using an automated DNA sequencer. (
. Nucleotide differences between strains can be checked at a variable number of genes depending on the degree of discrimination desired. Approximately bp internal fragments of each gene are used, as these can be accurately sequenced on both strands using an automated DNA sequencer. (")
9
MSTs estimation and MSNs creation
Materials and Methods MSTs estimation and MSNs creation Kruskal’s algorithm with input by node order randomization Combination of all edges defined within unique MSTs constitutes MSN.

11
Number estimation of possible MSTs
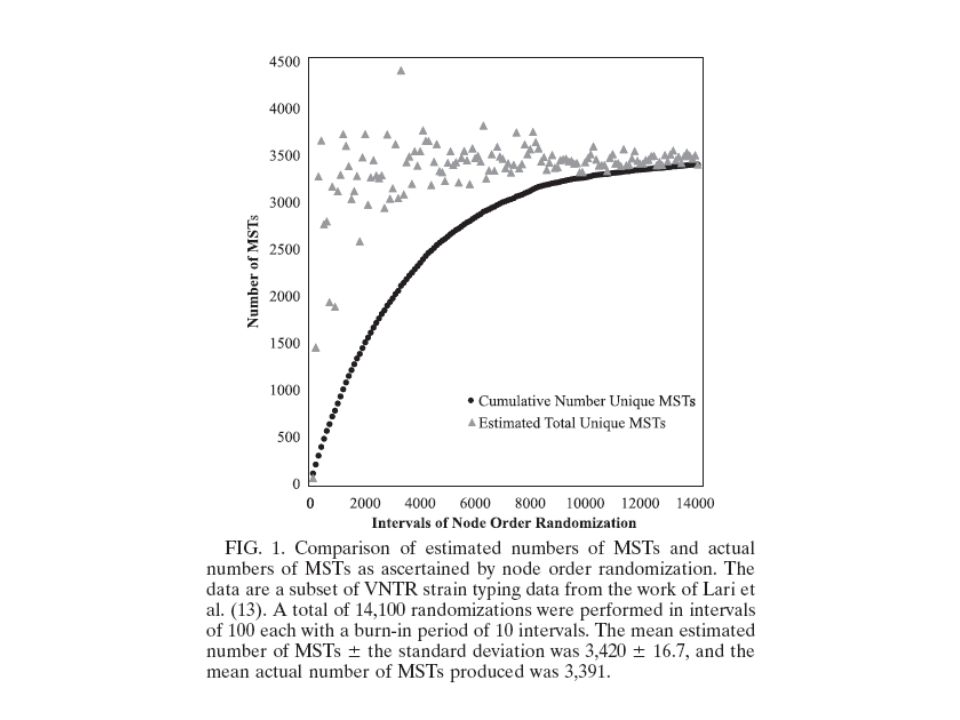
Materials and Methods Number estimation of possible MSTs through mark-recapture (Schnabel method) N = [(M+1)(C+1)] ÷ (R+1) - 1 N+1 = [(M+1)(C+1)] ÷ (R+1) (M+1) ÷ (N+1) = (R+1) ÷ (C+1) M:Mark C:Current R:Recapture
 N = [(M+1)(C+1)] ÷ (R+1) - 1. N+1 = [(M+1)(C+1)] ÷ (R+1) (M+1) ÷ (N+1) = (R+1) ÷ (C+1) M:Mark. C:Current. R:Recapture.")
12
Materials and Methods Bootstrapping
To establish confidence level of a model 100 individual pseudoreplicates for each MST Bootstrap value expressed as the fraction of pseudoreplicates yielding the same inference as the original data Given enough information, there should be sufficiently redundant data that independent pseudoreplicates will yield analyses identical to that of the complete data set. Computational simplicity; widespread use in phylogenetics; used anecdotally with MSTs

14
Bootstrap Efron and Gong (1983) Diaconis and Efron (1983) Felsenstein, J Confidence limits on phylogenies: an approach using the bootstrap. Evolution 39:783–791 Inferring the variability in an unknown distribution from which your data were drawn by resampling from the data The basic idea of the bootstrap involves inferring the variability in an unknown distribution from which your data were drawn by resampling from the data. The resampling process is done many times, each time producing a fictional sample of n points by sampling with replacement from the original n data points. The essential idea of the bootstrap is that this set of estimates has a distribution that approximates the distribution of the actual estimate t. A justifiable procedure is to bootstrap across the sites, that is, to sample sites from the data table with replacement. A more serious difficulty is lack of independence of the evolutionary processes in different sites.

15
Estimating alternative MSTs
Results Estimating alternative MSTs Multiple, equally parsimonious solutions possible Kruskal’s MST algorithm sensitive to node input order Schnabel method appropriate to estimate the number of alternative MSTs, esp. after discarding the early cycles of node order randomization

17
note for number estimation of possible MSTs
through mark-recapture (Schnabel method) N = [(M+1)(C+1)] ÷ (R+1) - 1 N+1 = [(M+1)(C+1)] ÷ (R+1) (M+1) ÷ (N+1) = (R+1) ÷ (C+1) M:Mark C:Current R:Recapture
 N = [(M+1)(C+1)] ÷ (R+1) - 1. N+1 = [(M+1)(C+1)] ÷ (R+1) (M+1) ÷ (N+1) = (R+1) ÷ (C+1) M:Mark. C:Current. R:Recapture.")
18
The number of possible MSTs is proportional only to the number of minimal pairwise distances with equal lengths. There is a relationship between the number of possible MSTs and the method used to compute the pairwise distance matrix.

19
note for distance matrix computation
Equidistant method – sites scored merely as “same” or “different” such that any difference carries the same weight Difference method – distances between sites calculated on the basis of the difference between the values of the two sites

20
There were significantly fewer alternative MSTs possible when the same data were processed using the difference method. There is a relationship between the type of data used and the number of possible alternative MSTs.

21
Estimating alternative MSTs
Results Estimating alternative MSTs When there are limited numbers of informative sites and alleles are treated as equidistant from one another, there are many pairwise distances of the same length, and large numbers of MSTs are possible. Basing analyses on the arithmetic number of pairwise differences among individuals both limits the number of possible MSTs and more faithfully represents the genetic distances between individuals.

22
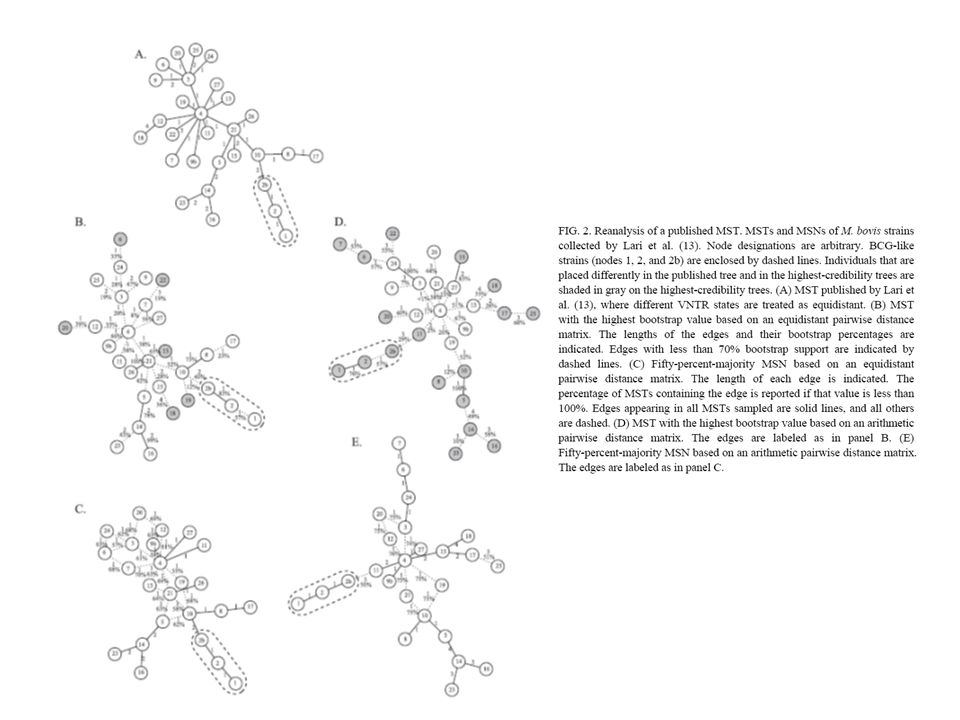
Results Creating MSN Approximation by majority rule
dashed line – edges present in ≧ 50% of MSTs solid line – edges present in 100% of MSTs Fraction ≠ Credibility

24
Estimating credibility of MSTs
Results Estimating credibility of MSTs Within any set of alternative MSTs examined, the individual trees demonstrated a considerable range of average bootstrap values. Although all MSTs in the MSN are equally parsimonious, some tree configurations are more statistically robust.

25
Estimating credibility of MSTs
Results Estimating credibility of MSTs By restricting analysis to a single, arbitrary MST, there is considerable risk in picking a tree with an inferior credibility. By surveying and evaluating trees within the MSN, it is possible to identify those with more credible configurations.

26
Results Systematic approach to MST estimation

27
Discussion Failing to consider alternative solutions (MSTs) can easily mislead or confound our understanding of population structure. Molecular epidemiology has yet to adopt measures to evaluate the credibility of the estimation. Presenting a single MST neither explores the range of alternative hypotheses nor evaluates the quality of MSTs based on their relative credibilities.

28
Discussion ~ proposed approach to MST analysis ~
1. The distance matrix that maximizes the differences between individuals is calculated. For VNTR data, a distance matrix calculated by the difference method should be used, and for MLST data, distances should be computed from the underlying DNA sequence data. 2. Instead of returning a single, arbitrarily selected MST, the MSN (representing or approximating the entire population of alternative MSTs) is reported. The total number of possible MSTs is estimated using a mark-recapture calculation.
 is reported. The total number of possible MSTs is estimated using a mark-recapture calculation.")
29
Discussion ~ proposed approach to MST analysis ~
3. A bootstrapping metric is employed to estimate the credibility of individual MSTs within the population of alternative solutions comprising the MSN. As many MSTs as time permits are subjected to bootstrap analysis so that the most reliable MST topology can be estimated and statistical support for particular relationships may be ascertained. 4. The most credible hypothesis or hypotheses within the larger population of MSTs are reported.

30
Thanks for Your Attention !

Similar presentations


>")


 The order of the base pairs in the sequence of every human varies In a single.>")


 Phylogenetic Trees (I) Maximum Parsimony.>")

 and likelihood methods, pairwise distance methods form the third large group of methods to infer evolutionary trees.>")


 Phylogenetic Trees (III) Probabilistic methods.>")

>")