Download presentation
Presentation is loading. Please wait.

1
Evaluation Results 2002-2008

2
MRI’s Evaluation Activities: Surveys Teacher Beliefs and Practices (pre/post) Annual Participant Questionnaire Data Collection Test Scores Standardized Tests Classroom Assessments (DRA) MAP Demographics Special Education Information MAP Analyses
 Annual Participant Questionnaire Data Collection Test Scores Standardized Tests Classroom Assessments (DRA) MAP Demographics Special Education Information MAP Analyses")
3
MAP ANALYSES: Map analyses compare schools that have finished the MRI program with a randomly chosen sample of non-MRI elementary schools Results indicate MRI schools generally outperform non-MRI schools (Not proof of a causal relationship)
")
4
Notes for MAP Analyses 2002-2005 Note: With the following MAP Analyses 2002-2005 charts the numbers are not as important as the comparative performance between MRI and non-MRI schools. This is because: 1.There is variation in the scores from year to year and school to school. 2.The calculation of the baseline changes as more data becomes available. The longer baselines mean there is less variation resulting in “flatter” or lower results. –For 2002 schools 1999 was the baseline –For 2003 schools an average of 1999/2000 was the baseline –For 2004 schools an average of 1999/2001 was the baseline –For 2005 schools an average of 2000/2002 was the baseline

5
2002-2005 Comparison of MRI and Random Samples Average % Change in Communication Arts Index per School

6
MAP Results In 2006 the MAP Communication Arts test was changed in ways that make comparisons to previous years difficult: Achievement levels were reduced from five to four Scaled Score intervals for categories were changed Questions were adjusted to apply to multiple grade levels that were tested (Grades 3-8 instead of only 3 and 7)
")
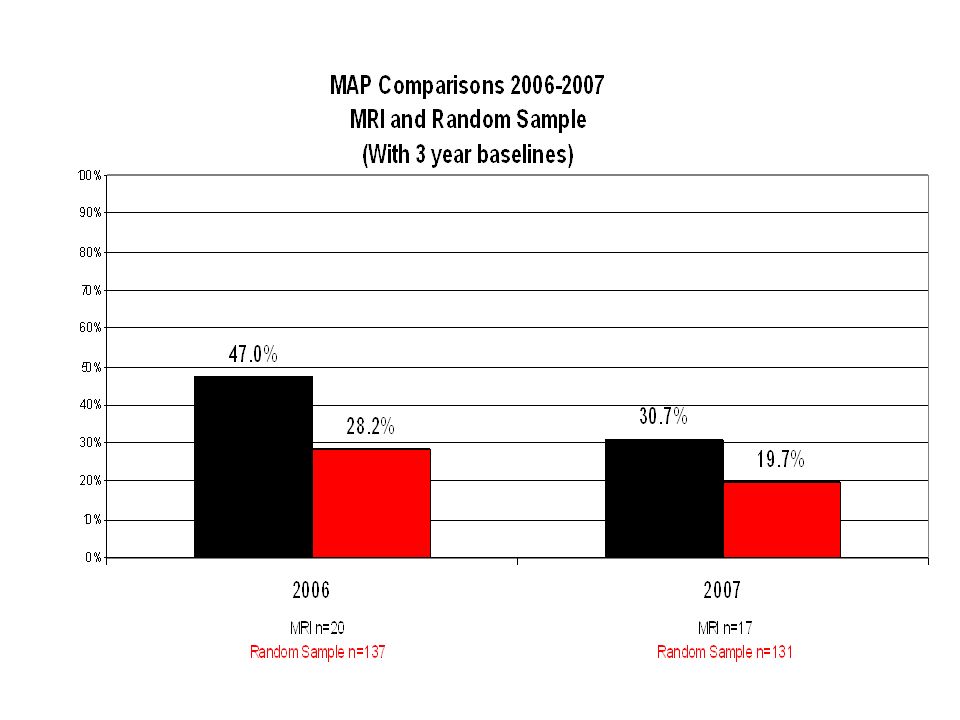
7
MAP Results: 2006-2007 For 2006-2007 the comparison between MRI and the random sample of Missouri elementary schools was made in terms of the percentage change between a 3 Year Baseline and the outcome year of students who scored in the top two achievement levels (Proficient and Advanced) 2006: Baseline=2002-2004 2007: Baseline=2003-2005 In 2006 This was done for 1st and 2nd year K-3 MRI schools (n=20) because there was only one 3rd year graduating school in 2006 In 2007 the analysis was done for 3rd Year schools only (n=17) for all grades 3-8
 2006: Baseline= : Baseline= In 2006 This was done for 1st and 2nd year K-3 MRI schools (n=20) because there was only one 3rd year graduating school in 2006 In 2007 the analysis was done for 3rd Year schools only (n=17) for all grades 3-8")
9
2006-2008 MAP Analysis In 2008 we now have three years of data after the MAP test was revised in 2006. In this analysis we compare the results of MRI, two other Missouri Professional Development programs (Programs I and II), and a Random Sample (RS) of Missouri Elementary Schools The Outcome Measure is the same as used by Federal and State programs in determining Adequate Yearly Progress or AYP: The percentage of students scoring at or above Proficiency
, and a Random Sample (RS) of Missouri Elementary Schools The Outcome Measure is the same as used by Federal and State programs in determining Adequate Yearly Progress or AYP: The percentage of students scoring at or above Proficiency.")
10
Steps in the 2006-2008 MAP Analysis Step 1: Get percentages of students Proficient or Advanced (Prof+) for each school 2006-2008 Source:://dese.mo.gov/schooldata/school_data.html AYP Reports://dese.mo.gov/schooldata/school_data.html Step 2: Calculate a baseline of the average Prof+ of 2006-2007. Step 3: Calculate the change (∆) in Prof+ in 2008 from the baseline for each school Step 4: Calculate average and median ∆ for each group: (MRI, I, II, and Random Sample) Step 5: Calculate standard deviations, skew, and pre- baseline average for each group Step 6: Remove all schools from each group whose ∆ was >2*SD Step 7: Repeat Steps 1-5
 in Prof+ in 2008 from the baseline for each school Step 4: Calculate average and median ∆ for each group: (MRI, I, II, and Random Sample) Step 5: Calculate standard deviations, skew, and pre- baseline average for each group Step 6: Remove all schools from each group whose ∆ was >2*SD Step 7: Repeat Steps 1-5.")
11
The data in this Table supports the statement that between 2006 and 2008 MRI schools made larger gains on average in the percentage of students scoring at Proficient or Better on the 2008 MAP Communication Arts test than two other Missouri professional development programs and a random sample of Missouri elementary schools. Samples in Table are from three different professional development programs and a random sample of schools in Missouri. The samples have been adjusted by removing “outliers” beyond +/- 2 Standard Deviations. Complete analysis, including supporting data, is available from MRI Research and Assessment.

12
As mandated by federal law, Missouri schools must make yearly progress goals in MAP scores For Communication Arts those goals were defined as the percentage of students scoring at Proficient or better 2003 - 19.4% 2004 - 20.4% 2005 - 26.6% 2006 - 34.7% 2007 - 42.9% 2008 - 51.0% The following Table provides a comparison between MRI schools and state-wide results. Adequate Yearly Progress

13
Percentage of Schools Meeting AYP Levels 1 2003=19.4% 2004=20.4% 2005=26.6% 2006=34.7% 2007=42.9% 2008=51.0% Proficient and Advanced YearMRIState 2003 81% (60 / 74) 50.9% (1,0469/2,053) 2004 100% (50 / 50) 77.27% (1,569/2,033) 2005 80% (28 /35) 64.7% (1,317/2,036) 2006 2 78.5% (22/27) 62.6% (1,291/2,061) 2007 81.5% (17/21) 53.6% (1,125/2,100) 2008 68.3% (28/41) +/-40% 3 (+/- 881/2,203) 1 Includes “Safe Harbor” and “Confidence Interval” results 2 Beginning in 2006 AYP was calculated for grades 3-8 and 11 3 In 2008 DESE reported the results for all schools as follows: “Only one-fourth of all school districts and about 40 percent of school buildings met this year’s proficiency targets for adequate yearly progress (AYP). “ The Title I ratio was more specific : 44.8% met AYP in 2008 (See- http://www.dese.mo.gov/news/2008/MAPandAYP.htm)

14
Teaching and Learning Survey In this survey classroom teachers were asked to identify instructional practices and frequencies of use (using a scale of 1=Never to 5=Almost Daily) of a number of critical elements related to the goals of MRI training. One way of looking at the data is by identifying those practices that were not frequently utilized by “pre” respondents (less than “3”), and ask if there were any changes reflected in the “post” responses.
, and ask if there were any changes reflected in the post responses..")
15
7: Assesses reading progress by use of informal assessments (running records, CAP, DRA, letter identification, etc.) 8: Implements reading workshop 11: Writes a text collaboratively with students sharing the pen 15: Collects student writing samples to document writing progress over time 16: Uses scoring guides/rubrics to assess student writing 17: Implements writing workshop 20: Organizes literacy corners to provide independent practice for students 21: Provides opportunities for students to use computers to write, publish, and practice Teaching and Learning Survey Items: K-3 “pre” (2005) Mean <3
 8: Implements reading workshop 11: Writes a text collaboratively with students sharing the pen 15: Collects student writing samples to document writing progress over time 16: Uses scoring guides/rubrics to assess student writing 17: Implements writing workshop 20: Organizes literacy corners to provide independent practice for students 21: Provides opportunities for students to use computers to write, publish, and practice Teaching and Learning Survey Items: K-3 pre (2005) Mean <3")
16
A7A8A11A15A16A17A20A21 20052.83.0 2.52.83.02.1 20083.74.43.53.32.94.23.92.5 In most of these categories there has been significant change of self- reported implementation of critical practices. Unlike previous years, however, three of the practices (A11, A15 and A16), do not show the same kind of robust growth as in the past. An early analysis of the data suggests this result may be because of a relatively high number of kindergarten teachers in the sample, teachers who might be less likely to use writing strategies than in other grades. 3rd Year Respondents (n=170) K-3 Practice Changes: 2005-2008 K-3 Practice Changes 2005-2008
, do not show the same kind of robust growth as in the past. An early analysis of the data suggests this result may be because of a relatively high number of kindergarten teachers in the sample, teachers who might be less likely to use writing strategies than in other grades. 3rd Year Respondents (n=170) K-3 Practice Changes: K-3 Practice Changes")
17
Teaching and Learning Survey Items: Upper Grades “pre” (2005) Mean <3 7: Assesses reading progress by use of informal assessments (running records, CAP, DRA, letter identification, etc.) 8: Implements reading workshop 12: Conferences with students individually to discuss their writing progress 13: Collects student writing samples to document writing progress over time 15: Implements writing workshop 18: Provides opportunities for students to use computers to write, publish, and practice
 Mean <3 7: Assesses reading progress by use of informal assessments (running records, CAP, DRA, letter identification, etc.) 8: Implements reading workshop 12: Conferences with students individually to discuss their writing progress 13: Collects student writing samples to document writing progress over time 15: Implements writing workshop 18: Provides opportunities for students to use computers to write, publish, and practice")
18
Upper Grade Respondents (n=116) A7A8A12A13A15A18 20052.83.0 2.62.7 20083.24.23.52.93.73.1 4-8 Practice Changes 2005-2008 The evidence presented here supports the statement that while there were practice changes, the strength of the variation is less than that which was observed for the K-3 school. Indeed, in one case (A13) no change in component usage was reported, and bears closer scrutiny. The differences in intensity between K-3 and Upper Grade teaching cohorts are likely a result of the fact that the upper grades are more departmentalized with more content area teachers whose primary responsibilities are in subject areas other than literacy. In addition, as noted in previous reports, upper grade teachers are more likely to use technology as an instructional tool (A18).
 no change in component usage was reported, and bears closer scrutiny. The differences in intensity between K-3 and Upper Grade teaching cohorts are likely a result of the fact that the upper grades are more departmentalized with more content area teachers whose primary responsibilities are in subject areas other than literacy. In addition, as noted in previous reports, upper grade teachers are more likely to use technology as an instructional tool (A18)..")
19
Participants rate the usefulness of component utilization, practice change, "buy in", attitudes toward the program and trainer, etc. Results drive program change; e.g.; Program Orientation Upper Grade Program 2008 Participant Survey Please see the “2007 Survey Results” Power Point presentation at http://missourireadinginitiative.com/program_evaluation.php http://missourireadinginitiative.com/program_evaluation.php for more detailed results of the Participant Survey between 2002 and 2007.

20
There are two positive trends reflected in the MRI End of the Year Participant Questionnaire: (1) Participants rate the program higher with passage of time; and (2) each year sees the entry level of satisfaction rise for new cohorts. The following tables demonstrate these trends between 2002 and 2008 Participant Survey

21
*3rd Year schools were interviewed in 2002 We have found that ratings generally go up from year to year as participants become more familiar with the program and, more importantly, begin to see the tangible results of improved student reading in their classrooms. Participant Survey “Rate” by MRI Program Year 2002-2004 Reflecting on the effectiveness of the MRI program as a whole, how would you rate it? Poor Excellent 1 2 3 4 5

22
Beginning in 2005 MRI began expanding to higher grades which have different dynamics and different scoring tendencies. Briefly, because the upper grades are increasingly departmentalized, content area teachers are usually more resistant to literacy professional development when compared to communication arts specialists. Over time, however, upper grade scores improved to K-3 levels as MRI Trainers responded to participants’ concerns and adapted the program to upper grade teachers’ needs. Participant Survey “Rate” by MRI Program Year 2005-2008 *In 2008 1st year and 4-6 scores were depressed by an “outlier” district where four participating schools had unusually low scores. MRI staff will use this information to address whatever implementation issues there are and, as a consequence, we would expect to see the scores rebound in 2008-2009.

23
DRA Results: The Developmental Reading Assessment tool (DRA) is a formalized classroom assessment that has proven to be an accurate indicator of a student’s actual reading level. This is a key element of the MRI program as “assessment drives instruction” and allows teachers to be highly specific in responding to each individual student’s needs. The following slide presents information about the changes in the percentages of students reading “At or Above” Grade Level at 2nd and 3rd MRI year schools for which the DRA data has been reported and analyzed as of 9/30/2008. The results are organized by grade level cohorts; that is, students who are in the same class as they move up grade levels. ALL reporting cohorts show significant increases in students reading “At or Above” Grade Level as measured by the DRA.

24
DRA Change in Percentage of Students Reading “At or Above” Grade Level (“F”=Fall; “S”=Spring) SchoolGrade CohortPre-datePost-datePre%Post% Change 112S07S0882.187.76.8 212S07S0851.976.647.6 313S06S0842.364.251.8 413S06S0852.287.868.2 513S06S085284.863.1 613S06S0873.991.123.3 713S06S0872.780.211.1 813F06S087.466.7801.4 913F05S0820.466.7226.9 1013F05S0820.343.4113.8 1123F06S0847.26231.4 1245F06S0835.775.4111.2 1346F05S0838.188.7132.8 1446F05S0855.787.256.6 1546F05S0860.981.533.8 1646F05S088.761.5606.9 1746F05S0813.970403.6 Average for All reported schools164.1
 SchoolGrade CohortPre-datePost-datePre%Post% Change 112S07S S07S S06S S06S S06S S06S S06S F06S F05S F05S F06S F06S F05S F05S F05S F05S F05S Average for All reported schools164.1")
Similar presentations

>")


 Oklahoma State.>")


 Value-added Score (VAM) where.>")


