Download presentation
Presentation is loading. Please wait.

1
The Link between Default and Recovery Rates: Implications for Credit Risk Models and Procyclicality Edward I. Altman, Brooks Brady, Andrea Resti, and Andrea Sironi 羅德謙 詹燿華

2
Introduction This paper analyzes the impacts of credit models’ assumptions The association between probability of default (PD) and the loss given default(LGD) on banks loans and corporate bonds The effects of this relationship on credit VaR models The Effects of the PD-LGD Correlation on Credit Risk Measure: Simulation Results The Procyclicality effects of the new capital requirements proposed by Basel Committee.
 and the loss given default(LGD) on banks loans and corporate bonds The effects of this relationship on credit VaR models The Effects of the PD-LGD Correlation on Credit Risk Measure: Simulation Results The Procyclicality effects of the new capital requirements proposed by Basel Committee.")
3
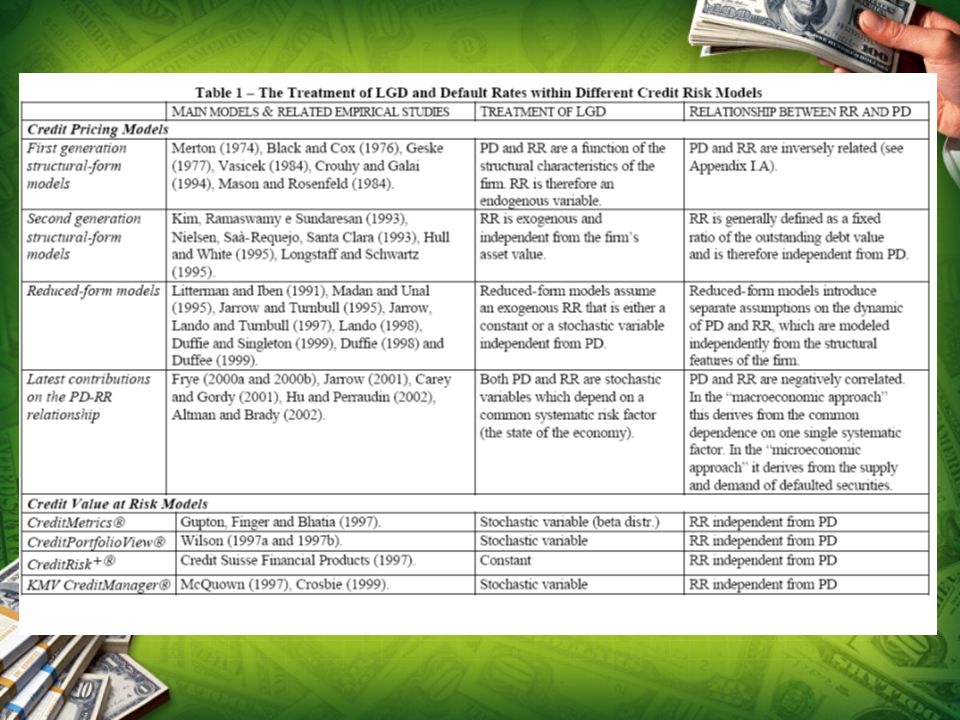
The Relationship between PD and RR Credit risk Model Credit pricing models “First generation” structural-form models “Second generation” structural-form models Reduced-form models Portfolio credit value-at-risk (VaR) model Finally, the relationship between probability of default (PD) and recovery rates (RR) are briefly analyzed
 model Finally, the relationship between probability of default (PD) and recovery rates (RR) are briefly analyzed")
4
“First generation” structural-form models: the Merton approach Using the principles of option pricing (Balck and Scholes, 1973) Default occurs when the value of a firm’s assets (the market value of the firm) is lower than that of its liabilities The payment to the debtholders =Min( market value of the firm, face value of the debt ) = face value of the debt – put option (S=,K=D)
 Default occurs when the value of a firm’s assets (the market value of the firm) is lower than that of its liabilities The payment to the debtholders =Min( market value of the firm, face value of the debt ) = face value of the debt – put option (S=,K=D)")
5
“First generation” structural-form models: the Merton approach Using the principles of option pricing (Cont’) (Balck and Scholes, 1973) PD and RR are a function of the structural characteristic of the firm: asset volatility (business risk) and leverage (financial risk) PD and RR is inversely related If the firm’s value increases → PD decreases and RR increases If firm’s asset volatility increases → PD increases and RR decreases
 (Balck and Scholes, 1973) PD and RR are a function of the structural characteristic of the firm: asset volatility (business risk) and leverage (financial risk) PD and RR is inversely related If the firm’s value increases → PD decreases and RR increases If firm’s asset volatility increases → PD increases and RR decreases")
6
“Second generation” structural-form models: It’s assumed default may occur at any time between the issuance and maturity of the debt RR is exogenous and independent from the firm’s asset value RR is generally defined as a fixed ratio of the outstanding debt value and is therefore independent from PD

7
“Second generation” structural-form models: Three drawbacks They still require estimates for the parameters of the firm’s asset value, which is nonobservable They cannot incorporate credit-rating changes Most structural-form models assume that the value of the firm is continuous in time. Therefore, the time of default can be predicted just before it happens → no “sudden surprises”

8
Reduced-form models Reduced-form models assume an exogenous RR that is either a constant or a stochastic variable independent from PD Reduced-form models introduce separate assumptions on the dynamic of PD and RR, which are modeled independently from the structural features of the firm Empirical evidence concerning reduced-form models is rather limited

9
Latest contributions on the PD-RR relationship Frye (2000a and 2000b), Jarrow (2001), …, Altman and Brady (2002) Both PD and RR are stochastic variables which depend on a common systematic risk factor( the state of the economy). PD and RR are negatively correlated. In the “macroeconomic approach” it derives from the common dependence on one single systematic factor. In the “microeconomic approach” it derives from the supply and the demand of defaulted securities

10
Credit Value at Risk Models Credit VaR models assume an exogenous RR that is either a constant or a stochastic variable independent from PD It is important to highlight that all credit VaR models treat PD and RR as two independent variables. CreditMetricsJP Morgan1997independent CreditPortfolioViewMcKinsey1997independent KMV CreditManagerKMV1997independent CreditRiskCSFP1997constant

12
Concluding Remarks Merton(1974) derives an inverse relationship between PD and RR The credit models developed in 1990’s treat PD and RR as independent, which is strongly contrasts with the empirical evidence In the next section we relax the assumption of independence between PD and RR and simulate the impact on VaR models
 derives an inverse relationship between PD and RR The credit models developed in 1990’s treat PD and RR as independent, which is strongly contrasts with the empirical evidence In the next section we relax the assumption of independence between PD and RR and simulate the impact on VaR models")
13
Montecarlo Simulation Assumptions of recovery rate: deterministic stochastic, yet uncorrelated with the probabilities of default. stochastic, and partially correlated with default risk

14
The Effects of the PD, LGD correlation on Credit Risk Measures: Simulation Results PD short =PD long *SHOCK*

15
Main Results of the LGD simulation

16
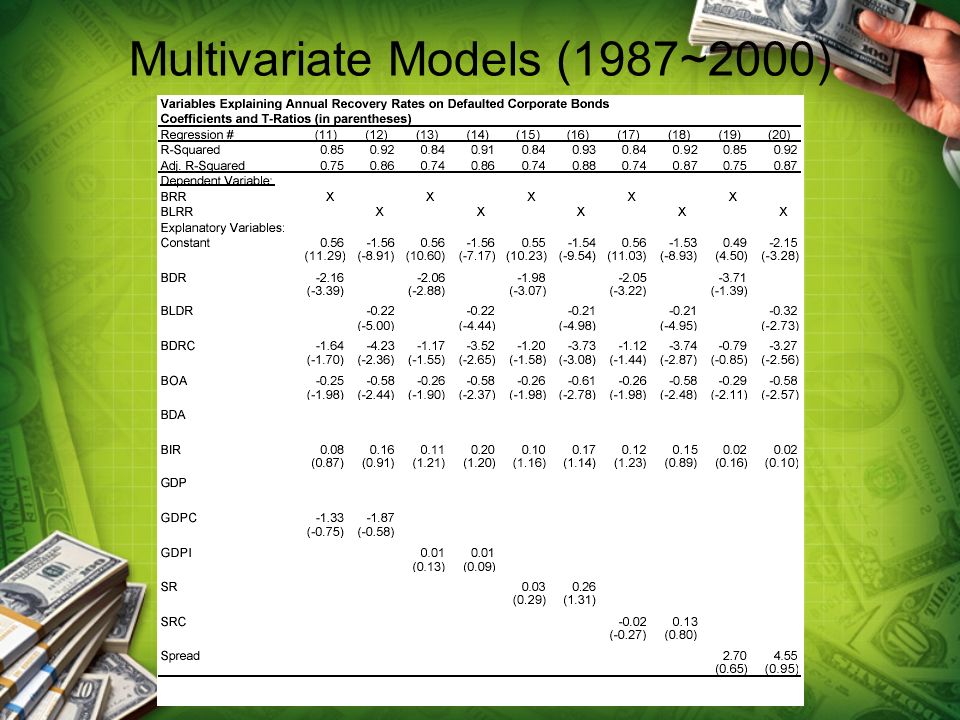
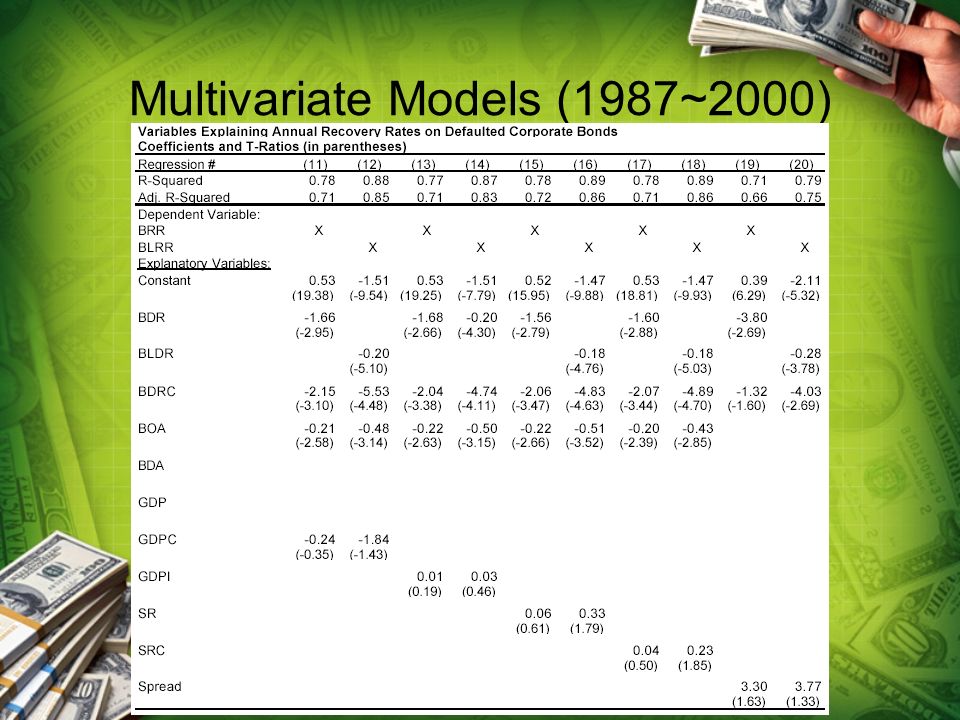
Empirical Results for RR Rating agencies: Moody’s, S&P, and Fitch Two dependent variable: BRR: aggregate annual bond recovery rate BLRR: the logarithm of BRR Two least squares regression models Univariate → 60% explanation power Multivariate → 90% explanation power

17
Explanatory Variables( Supply Side ) BDR(-) The weighted average default rate on bonds in the high yield bond market BDRC(-) One year change in BDR BOA(-) Total amount of high yield bonds outstanding for a particular year BDA(-) Bond default amount
 BDR(-) The weighted average default rate on bonds in the high yield bond market BDRC(-) One year change in BDR BOA(-) Total amount of high yield bonds outstanding for a particular year BDA(-) Bond default amount")
18
Explanatory Variables( Demand Side ) GDP(+) Annual GDP growth rate GDPC(+) Change in the annual GDP growth rate from the previous year GDPI(+) Takes the value of 1 when GDP growth was less than 1.5% and 0 when GDP growth was greater than 1.5% SR(+) Annual return on S&P 500 stock index SRC(+) Change in the annual return on S&P 500 stock index from the previous year
 GDP(+) Annual GDP growth rate GDPC(+) Change in the annual GDP growth rate from the previous year GDPI(+) Takes the value of 1 when GDP growth was less than 1.5% and 0 when GDP growth was greater than 1.5% SR(+) Annual return on S&P 500 stock index SRC(+) Change in the annual return on S&P 500 stock index from the previous year")
19
Default Rate and Losses

20
Univariate Models

21
Univariate Model

22
Recovery Rate/Default Rate Association

23
Multivariate Models (1987~2000)
")
28
The LGD/PD Link and the Procyclicality Effect The Procyclicality Effect when economy is slowing → PD↑ → Bank’s regulatory capital ↑ → Corporate loan size ↓ vice versa Due to the new internal ratings-based (IRB) approach to regulatory capital, the banks’ portfolio (Loan size) has the procyclicality effect with PD
 approach to regulatory capital, the banks’ portfolio (Loan size) has the procyclicality effect with PD")
29
The LGD/PD link and the Procyclicality Effect

30
Concluding Remark The link between PD and RR Some credit models treat them as independent r.v. This assumption may be unrealistic through simulation results or empirical evidence The simulation result: The significant difference between RR assumptions is about 30% The empirical evidence: the statistic models show that PD is substantial inversed correlated with RR The link between PD and RR will bring about a sharp increase in the “procyclicality” effect of the new Basel Accord

Similar presentations


?>")


