Download presentation
Presentation is loading. Please wait.

1
Graduate school of Industrial Engineering & Management, National Yunlin University of Science & Technology System Reliability Lab. http://campusweb.yuntech.edu.tw/~qre/index.htm Economical Statistical Design of Combined Double Sampling and Variable Sampling Interval Joint X-bar and S Control Charts Student: Yi-Chun Chen Advisor: Chau-Chen Torng

2
YunTech Contents Introduction 1 Literature Review 2 Design of control charts 3 Expect result 4 2

3
YunTech 1.Introduction 1 Background & Motivation 2 Purposes Introduction Literature Review Design of control charts Expect result 3

4
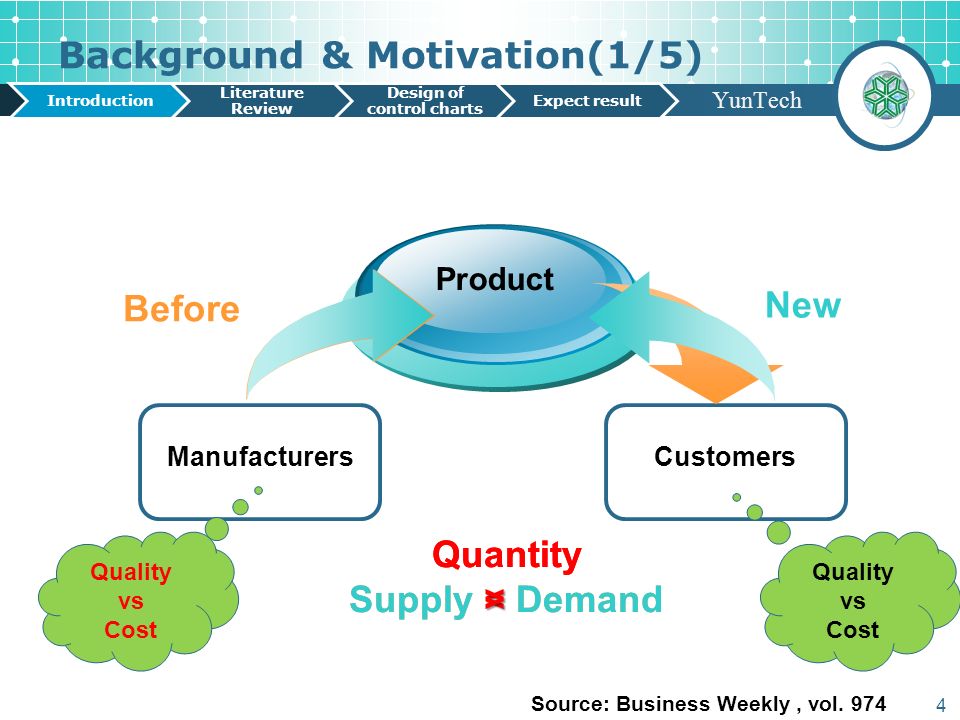
YunTech Background & Motivation(1/5) Introduction Literature Review Design of control charts Expect result Manufacturers Product Customers Quantity < Supply < Demand Before Quantity > Supply > Demand New Quality vs Cost Quality vs Cost Source: Business Weekly, vol. 974 4
5
YunTech Background & Motivation(2/5) Statistical Process Control (SPC) Introduction Literature Review Design of control charts Expect result Shewhart (1924) development X-bar control chart Control charts 5 Source: Montgomery, 2006 μ-3σ μ+3σ μ Out of control
 Statistical Process Control (SPC) Introduction Literature Review Design of control charts Expect result Shewhart (1924) development X-bar control chart Control charts 5 Source: Montgomery, 2006 μ-3σ μ+3σ μ Out of control")
6
YunTech Background & Motivation(3/5) Traditional Control chart Advantage Easy to operate, Detection large shift is sensitive Disadvantage Detection small & medium shift is not sensitive Introduction Literature Review Design of control charts Expect result 6 Control chart S X-bar & S X-bar & R Control chart adaptive
 Traditional Control chart Advantage Easy to operate, Detection large shift is sensitive Disadvantage Detection small & medium shift is not sensitive Introduction Literature Review Design of control charts Expect result 6 Control chart S X-bar & S X-bar & R Control chart adaptive")
7
YunTech Background & Motivation(4/5) 7 Introduction Literature Review Design of control charts Expect result Variable Sampling Size Double Sampling Variable Sampling Intervals Control chart Variable Sampling Size & Variable Sampling Intervals Variable Parameters Double Sampling & Variable Sampling Interval Adaptive control chart Daudin(1992) development DS control chart Costa(1994) development VSS control chart Reyonlds (1988)development VSI control chart Costa (1999)development VP control chart Costa (1997)development VSSI control chart Carot (2002)development DSVSI control chart better than single DS and single VSI control chart
 7 Introduction Literature Review Design of control charts Expect result Variable Sampling Size Double Sampling Variable Sampling Intervals Control chart Variable Sampling Size & Variable Sampling Intervals Variable Parameters Double Sampling & Variable Sampling Interval Adaptive control chart Daudin(1992) development DS control chart Costa(1994) development VSS control chart Reyonlds (1988)development VSI control chart Costa (1999)development VP control chart Costa (1997)development VSSI control chart Carot (2002)development DSVSI control chart better than single DS and single VSI control chart")
8
YunTech Background & Motivation(5/5) On the other hand, cost is very important for Manufacturers.Duncan(1956)construct economic design of control chart, that model purpose is minimize the average unit cost. The other some researcher find that single economic design of control chart model would made higher false alarm and lower power. Saniga(1989) economical statistical design of control chart. 8 Introduction Literature Review Design of control charts Expect result
 economical statistical design of control chart. 8 Introduction Literature Review Design of control charts Expect result.")
9
YunTech Purposes 1)Seek appropriate economic model and statistical model used on design of control charts. 2)By the analysis tool to find the best parameters of Economical statistical design of DSVSI X-bar & S control chart. 3)By sensitivity analysis to find the relationship between cost parameters and statistical performance. Introduction Literature Review Design of control charts Expect result 9
By the analysis tool to find the best parameters of Economical statistical design of DSVSI X-bar & S control chart. 3)By sensitivity analysis to find the relationship between cost parameters and statistical performance. Introduction Literature Review Design of control charts Expect result 9.")
10
YunTech 2.Literature Review 1 Joint X-bar & S control charts 2 Adaptive control chart 3 Design of control chart model Introduction Literature Review Design of control charts Expect result 10

11
YunTech 2.1 Joint X-bar & S control charts X-bar control chart S control chart Why do we want combination of X-bar and S control chart? Introduction Literature Review Design of control charts Expect result 11 (a)(c)(b) μ0μ0 μ0μ0 μ0μ0 UCLLCLUCLLCLUCLLCL Source: Montgomery,2008 σ0σ0 σ0σ0 σ1σ1 μ1μ1 μ-3σ μ+3σ μ Out of control
(c)(b) μ0μ0 μ0μ0 μ0μ0 UCLLCLUCLLCLUCLLCL Source: Montgomery,2008 σ0σ0 σ0σ0 σ1σ1 μ1μ1 μ-3σ μ+3σ μ Out of control.")
12
YunTech 2.2 Adaptive control chart A.Double Sampling(DS) control chart. B.Variable Sampling Interval(VSI) control chart. C.Double Sampling and Variable Sampling Interval(DSVSI) control chart. Introduction Literature Review Design of control charts Expect result 12
 control chart. C.Double Sampling and Variable Sampling Interval(DSVSI) control chart. Introduction Literature Review Design of control charts Expect result 12.")
13
YunTech DS X-bar control chart Dudin(1992) development DS X-bar control chart. 13 Introduction Literature Review Design of control charts Expect result Action Region Warning Region Central Region Warning Region Action Region Central Region Action Region First stage DS X-bar control chart Second stage DS X-bar control chart Change sampling size

14
YunTech VSI X-bar control chart Reyonlds et al. (1988) development VSI X-bar control chart. 14 Introduction Literature Review Design of control charts Expect result Action Region Warning Region Central Region Warning Region Action Region VSI X-bar control chart Change sampling interval

15
YunTech DSVSI X-bar & S control chart(1/2) Lee(2012)development DSVSI X-bar&S control chart. Design background 15 Introduction Literature Review Design of control charts Expect result Lee et al. Joint S and DSVSI DSVSI S Torng et al. Showed DSVSI X-bar batter than CUSUM non-normal He et al. Combing DS X-bar and DS S DS X-bar&S Carot et al. Combing DS X-bar and VSI X-bar DSVSI X-bar 2002200620102012

16
YunTech DSVSI X-bar & S control chart(2/2) 16 Introduction Literature Review Design of control charts Expect result ARAR WR II WR I CR WR I WR II AR ARAR CR AR ARAR WR II WR I CR ARAR First stage X-bar chartSecond stage X-bar chart First stage S chartSecond stage S chart n h n h n h
 16 Introduction Literature Review Design of control charts Expect result ARAR WR II WR I CR WR I WR II AR ARAR CR AR ARAR WR II WR I CR ARAR First stage X-bar chartSecond stage X-bar chart First stage S chartSecond stage S chart n h n h n h")
17
YunTech 2.3 Design of control chart model A.Economic design of control chart B.Statistical design of control chart Introduction Literature Review Design of control charts Expect result 17

18
YunTech Economic design of control chart 18 Introduction Literature Review Design of control charts Expect result τ D gn h/(1-β) 1/λ In control Out of control Cycle start Assignable cause Assignable cause removed Last sampling before Assignable cause First sampling after Assignable cause Lack of control detected Assignable cause located Ν Ν Duncan(1956)
 1/λ In control Out of control Cycle start Assignable cause Assignable cause removed Last sampling before Assignable cause First sampling after Assignable cause Lack of control detected Assignable cause located Ν Ν Duncan(1956)")
19
YunTech Statistical design of control chart Woodall(1986) find economic design of control chart will have higher false alarm and lower power. Saniga(1989)development economical statistical design of control chart. 19 Introduction Literature Review Design of control charts Expect result
development economical statistical design of control chart. 19 Introduction Literature Review Design of control charts Expect result.")
20
YunTech 3.Design of control charts 1 Symbol definition & description 2 Model assumptions 3 Modeling Introduction Literature Review Design of control charts Expect result 20

21
YunTech Sampling size(small)Warning limit to change sampling interval for X-bar Sampling size(big)Warning limit to change sampling interval for S Sampling interval(long)control limit to the first stage X-bar Sampling interval(short)control limit to the first stage S Warning limit to change sampling size for X-bar control limit to the second stage X- bar Warning limit to change sampling size for S control limit to the second stage S Fixed costsFalse alarm costs Variable costsExpected cost of the production defective products, in control Search assignable cause costsExpected cost of the production defective products, out of control Symbol definition & description (1/2) Introduction Literature Review Design of control charts Expect result 21
Warning limit to change sampling interval for X-bar Sampling size(big)Warning limit to change sampling interval for S Sampling interval(long)control limit to the first stage X-bar Sampling interval(short)control limit to the first stage S Warning limit to change sampling size for X-bar control limit to the second stage X- bar Warning limit to change sampling size for S control limit to the second stage S Fixed costsFalse alarm costs Variable costsExpected cost of the production defective products, in control Search assignable cause costsExpected cost of the production defective products, out of control Symbol definition & description (1/2) Introduction Literature Review Design of control charts Expect result 21")
22
YunTech Expected sample size of control chart Expected number of assignable cause occur per unit time Expected sample size of process in control The sampling interval h between jth and j+1th sampling, expected time of assignable cause occur Expected sample size of process out of control The sampling interval h 1 between jth and J+1th sampling, expected time of assignable cause occur Expected sampling interval of control chart The sampling interval h 2 between thf and J+1th sampling, expected time of assignable cause occur Expected sampling interval of process in control Expected time of assignable cause occur between jth and j+1th sampling Expected sampling interval of process out of control The average sampling and inspection time is a multiple of the expected size of the number of samples Expected cycle time of control chartSearched assignable cause to removed time, constant Expected cost of cycle time per unitExpected cost of control chart cycle time per unit Symbol definition & description (2/2) 22 Introduction Literature Review Design of control charts Expect result
 22 Introduction Literature Review Design of control charts Expect result")
23
YunTech 3.2 Model assumptions The initial state of a process is in control and the mean and standard deviation are μ= μ 0 and σ= σ 0. When an assignable cause occurs, μ 1 = μ 0 +δμ 0 or σ 1 = γσ 0. Quality characteristics X is subject to the normal distribution. The process just have only one assignable cause. The relationship between assignable cause and process variation time is exponential distribution, the expected value of 1/λ. Process variation is instantaneous. The process does not have the ability to repair itself. Introduction Literature Review Design of control charts Expect result 23

24
YunTech 3.3 Modeling A.Cycle Time Computation B.Cost Model Development C.Statistical Constraints Formulation Introduction Literature Review Design of control charts Expect result 24

25
YunTech Cycle Time Computation(1/2) E(nІδ,γ) =n 1 +n 2 ×P(change sampling sizeІδ,γ) P(change sampling sizeІδ,γ) A 25 Introduction Literature Review Design of control charts Expect result Second Warring Region
 E(nІδ,γ) =n 1 +n 2 ×P(change sampling sizeІδ,γ) P(change sampling sizeІδ,γ) A 25 Introduction Literature Review Design of control charts Expect result Second Warring Region")
26
YunTech Cycle Time Computation(2/2) 120120 26 j j+1 h1h1 Introduction Literature Review Design of control charts Expect result h2h2 j j+1
 120120 26 j j+1 h1h1 Introduction Literature Review Design of control charts Expect result h2h2 j j+1")
27
YunTech Cycle Time Computation 27 ζ D GE(n) AATS 1/λ In control Out of control Cycle start Assignable cause Assignable cause removed Last sampling before Assignable cause First sampling after Assignable cause Lack of control detected Assignable cause located Ν Ν 1/λ In control AATS GE(n) D E(T)=1/λ+AATS+GE(n)+D
 AATS 1/λ In control Out of control Cycle start Assignable cause Assignable cause removed Last sampling before Assignable cause First sampling after Assignable cause Lack of control detected Assignable cause located Ν Ν 1/λ In control AATS GE(n) D E(T)=1/λ+AATS+GE(n)+D")
28
YunTech E(C) sampling and inspection Cost Model Development 28 4 3 2 1 defective products cost C 0 ×1/λ+C 1 ×AATS False alarm times α ×s False alarm costs a 3 ’× α ×s Search assignable cause costs a 3
 sampling and inspection Cost Model Development defective products cost C 0 ×1/λ+C 1 ×AATS False alarm times α ×s False alarm costs a 3 ’× α ×s Search assignable cause costs a 3")
29
YunTech Statistical Constraints Formulation Min s.t. 29 S control chart X-bar control chart

30
YunTech 4.Expect result The economical statistical design of Combined DSVSI Joint X-bar and S Control Charts optimal combination of parameters obtained by solving tool. Use sensitivity analysis to find relationship between cost parameters and cost, relationship between cost and statistical performance. Lorenzen(1986) ±30% Introduction Literature Review Design of control charts Expect result 30 a1a1 a2a2 a3a3 a3’a3’C0C0 C1C1 λGD 04.221086977.4114.24949.20.025/60
 ±30% Introduction Literature Review Design of control charts Expect result 30 a1a1 a2a2 a3a3 a3’a3’C0C0 C1C1 λGD /60.")
31
Graduate school of Industrial Engineering & Management, National Yunlin University of Science & Technology System Reliability Lab. http://campusweb.yuntech.edu.tw/~qre/index.htm

Similar presentations


. Quality of Manufacturing Process depends on Entry Criteria.>")


 Peter Ping Liu, Ph D, PE, CQE, OCP and CSIT Professor and Coordinator of Graduate Programs.>")


 Li IND E 516 Homework 1.>")
 2009 John Wiley & Sons, Inc.>")


