Download presentation
Presentation is loading. Please wait.

1
Business Statistics: A Decision-Making Approach, 6e © 2005 Prentice-Hall, Inc. Chap 7-1 4th Lesson Estimating Population Values part 2

2
Business Statistics: A Decision-Making Approach, 6e © 2005 Prentice-Hall, Inc. Chap 7-2 Confidence Intervals Population Mean 2 population Confidence Intervals Population Proportion 1 population Population Variance

3
Business Statistics: A Decision-Making Approach, 6e © 2005 Prentice-Hall, Inc. Chap 7-3 Confidence Intervals for the Population Proportion, p An interval estimate for the population proportion ( p ) can be calculated by adding an allowance for uncertainty to the sample proportion ( p )
 can be calculated by adding an allowance for uncertainty to the sample proportion ( p ).")
4
Business Statistics: A Decision-Making Approach, 6e © 2005 Prentice-Hall, Inc. Chap 7-4 Confidence Intervals for the Population Proportion, p Recall that the distribution of the sample proportion is approximately normal if the sample size is large, with standard deviation We will estimate this with sample data: (continued)
.")
5
Business Statistics: A Decision-Making Approach, 6e © 2005 Prentice-Hall, Inc. Chap 7-5 Confidence interval endpoints Upper and lower confidence limits for the population proportion are calculated with the formula where z is the standard normal value for the level of confidence desired p is the sample proportion n is the sample size

6
Business Statistics: A Decision-Making Approach, 6e © 2005 Prentice-Hall, Inc. Chap 7-6 Example A random sample of 100 people shows that 25 are left-handed. Form a 95% confidence interval for the true proportion of left-handers

7
Business Statistics: A Decision-Making Approach, 6e © 2005 Prentice-Hall, Inc. Chap 7-7 Example A random sample of 100 people shows that 25 are left-handed. Form a 95% confidence interval for the true proportion of left-handers. 1. 2. 3. (continued)
.")
8
Business Statistics: A Decision-Making Approach, 6e © 2005 Prentice-Hall, Inc. Chap 7-8 Interpretation We are 95% confident that the true percentage of left-handers in the population is between 16.51% and 33.49%. Although this range may or may not contain the true proportion, 95% of intervals formed from samples of size 100 in this manner will contain the true proportion.

9
Business Statistics: A Decision-Making Approach, 6e © 2005 Prentice-Hall, Inc. Chap 7-9 Changing the sample size Increases in the sample size reduce the width of the confidence interval. Example: If the sample size in the above example is doubled to 200, and if 50 are left-handed in the sample, then the interval is still centered at.25, but the width shrinks to.19 …….31

10
Business Statistics: A Decision-Making Approach, 6e © 2005 Prentice-Hall, Inc. Chap 7-10 Finding the Required Sample Size for proportion problems Solve for n: Define the margin of error: p can be estimated with a pilot sample, if necessary (or conservatively use p =.50)
.")
11
Business Statistics: A Decision-Making Approach, 6e © 2005 Prentice-Hall, Inc. Chap 7-11 What sample size...? How large a sample would be necessary to estimate the true proportion defective in a large population within 3%, with 95% confidence? (Assume a pilot sample yields p =.12)
.")
12
Business Statistics: A Decision-Making Approach, 6e © 2005 Prentice-Hall, Inc. Chap 7-12 What sample size...? Solution: For 95% confidence, use Z = 1.96 E =.03 p =.12, so use this to estimate p So use n = 451 (continued)
.")
13
Confidence Intervals for Two Population Proportion, p Business Statistics: A Decision-Making Approach, 6e © 2005 Prentice-Hall, Inc. Chap 7-13

14
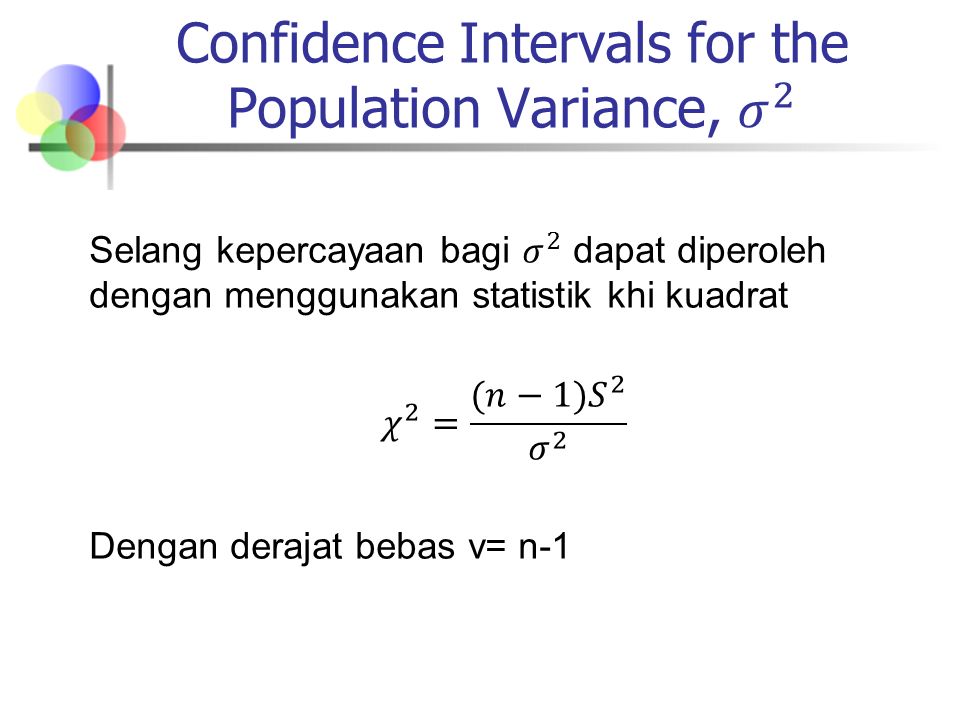
Business Statistics: A Decision-Making Approach, 6e © 2005 Prentice-Hall, Inc. Chap 7-14 Confidence Intervals Population Mean 2 population Confidence Intervals Population Proportion 1 population Population Varians

Similar presentations


 Objective Find the confidence.>")


 Chapter 8 Confidence Interval Estimation.>")

