Download presentation
Presentation is loading. Please wait.

1
Mars Express «atmospheric sciences » Inputs for TGO… François FORGET Mars Express Interdisciplinary Scientist IPSL Laboratoire de Météorologie Dynamique CNRS, Paris, France + the Mars Express teams !

2
Outline Introduction to Mars Express Mars meteorology – Temperatures – Surface pressure – Dust and clouds Water vapor Other Trace gases

3
Mars Express Orbiter 7 main Instruments : HRSC (camera) : visible OMEGA (imaging Vis and NIR spectrometer) : 0.3-5.2 µm PFS (NIR and thermal spectrometer): SWC:1.2-5.8 µm + LWC 6-50 µm SPICAM (UV and NIR atmospheric spectrometer): 0.1-0.31 µm + 1-1.7 µm ASPERA (Energetic Neutral Atoms Imager MaRS: Radio Science Experiment Marsis : Radar
 : visible OMEGA (imaging Vis and NIR spectrometer) : µm PFS (NIR and thermal spectrometer): SWC: µm + LWC 6-50 µm SPICAM (UV and NIR atmospheric spectrometer): µm µm ASPERA (Energetic Neutral Atoms Imager MaRS: Radio Science Experiment Marsis : Radar")
4
Eccentric Orbit + Pericenter latitude drift

5
Pericenter latitude = f(t) 10/01/04 30/05/04 Sun elevation i < 0° 0 < i < 15° 15° < i <30° I > 30° orbit 10000 upcoming this year - Mission extension confirmed for 2011+2012 - and adopted for 2013+2014, pending mid-term confirmation.
 10/01/04 30/05/04 Sun elevation i < 0° 0 < i < 15° 15° < i <30° I > 30° orbit upcoming this year - Mission extension confirmed for and adopted for , pending mid-term confirmation.")
6
Thermal structure in the lower atmosphere with PFS spectral resolution 1.8 cm-1 PFS TES

7
Zasova et al.

8
PFS obs GCM model Morning Evening Thermal structure below 50 km : LMD GCM prediction with Mars Express PFS ( Giuranna et al. 2007 ) 60 km 40 km 20 km 60 km 40 km 20 km Ls = 50°-70° (N. spring)
 60 km 40 km 20 km 60 km 40 km 20 km Ls = 50°-70° (N. spring).")
9
PFS aerosol thermal infared observations Silicate dust Water ice clouds of different kinds -polar hood -topographic clouds -equatorial cloud belt -morning haze -night fog in Hellas -clouds above the melting polar cap.

10
One Lesson from Mars Express: Meteorology data from PFS (T(z), dust, clouds) could have been shared as well as possible and as early as possible with the other instruments team to help data processing Role of MCS on TGO
, dust, clouds) could have been shared as well as possible and as early as possible with the other instruments team to help data processing Role of MCS on TGO")
11
MaRS : radio sciences (Pätzold et al. Tellmann et al.) uses the Radio Subsystem (High Gain Antenna) of Mars Express no Ultrastable Oscillator (only ingress) But: higher sensitivity of measurement in Twoway coherent downlink at two frequencies: X-Band (8.4 GHz) S-Band (2.3 GHz)
 uses the Radio Subsystem (High Gain Antenna) of Mars Express no Ultrastable Oscillator (only ingress) But: higher sensitivity of measurement in Twoway coherent downlink at two frequencies: X-Band (8.4 GHz) S-Band (2.3 GHz).")
12
MaRS : radio sciences Comparison with MGS Solar Longitude (Pätzold et al. Tellmann et al.)
")
13
Comparison with MGS Local Time (Pätzold et al. Tellmann et al.)
")
14
Upper atmosphere temperature with SPICAM stellar occultations (60-130 km) [Forget et al. 2009]
![Upper atmosphere temperature with SPICAM stellar occultations ( km) [Forget et al. 2009]](http://images.slideplayer.com/26/8393044/slides/slide_14.jpg "Upper atmosphere temperature with SPICAM stellar occultations ( km) [Forget et al. 2009]")
16
Density to Temperature profiles CO2 densityTemperature Ls = 11°, 16.8°N Spectra Slant densities

17
Montmessin et al. 2011

18
Surface pressure retrievals with OMEGA at 2 µm

19
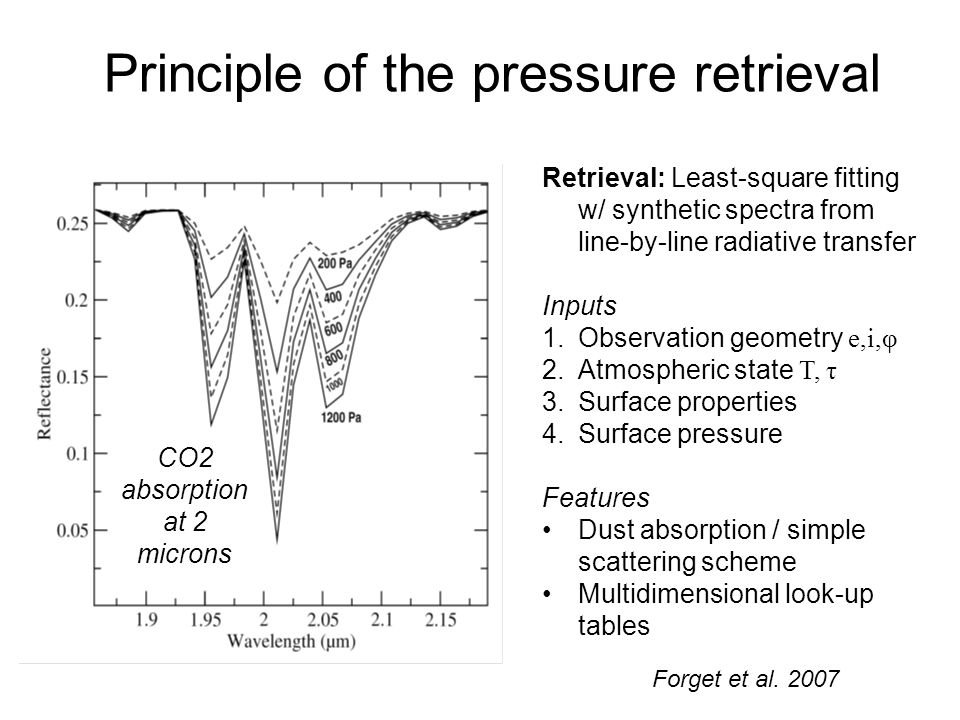
Principle of the pressure retrieval CO2 absorption at 2 microns Retrieval: Least-square fitting w/ synthetic spectra from line-by-line radiative transfer Inputs 1.Observation geometry e,i,φ 2.Atmospheric state T, τ 3.Surface properties 4.Surface pressure Features Dust absorption / simple scattering scheme Multidimensional look-up tables Forget et al. 2007
20
Seasonal CO2 cycle monitored by OMEGA Forget et al. 2007

21
Surface pressure oscillations Very flat topography Spiga et al. 2007

22
Surface pressure oscillations Ozone oscillations (above 20 km) – Thanks to F. Altieri Spiga et al. 2007

23
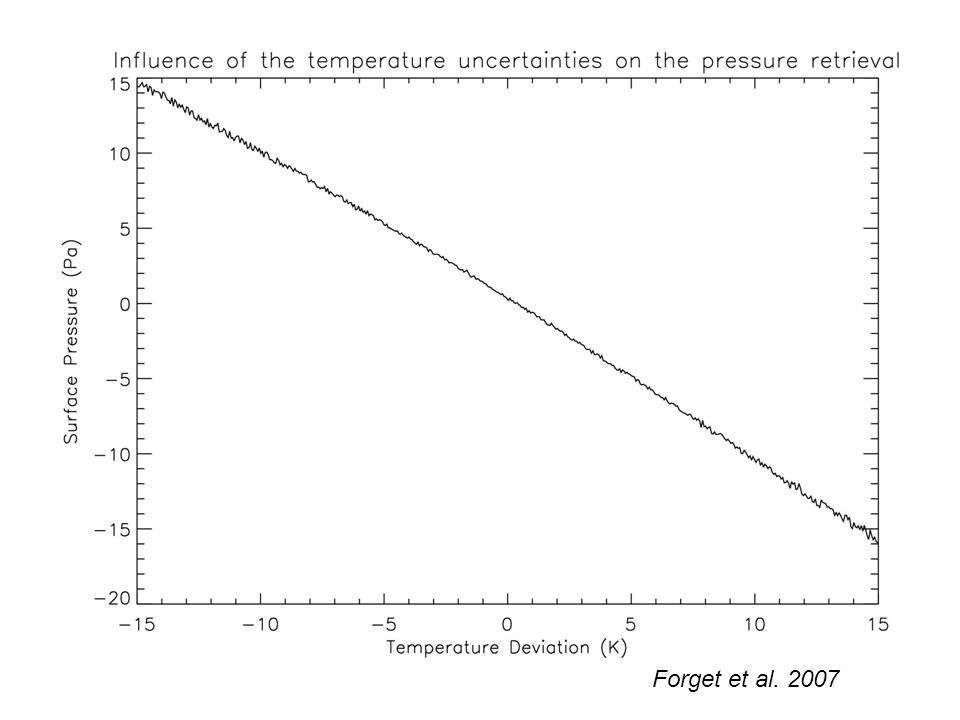
Relative error on a given pressure measurement –Temperature –Dust opacity –Pyroxenes –Instrumental noise Forget et al. 2007

24
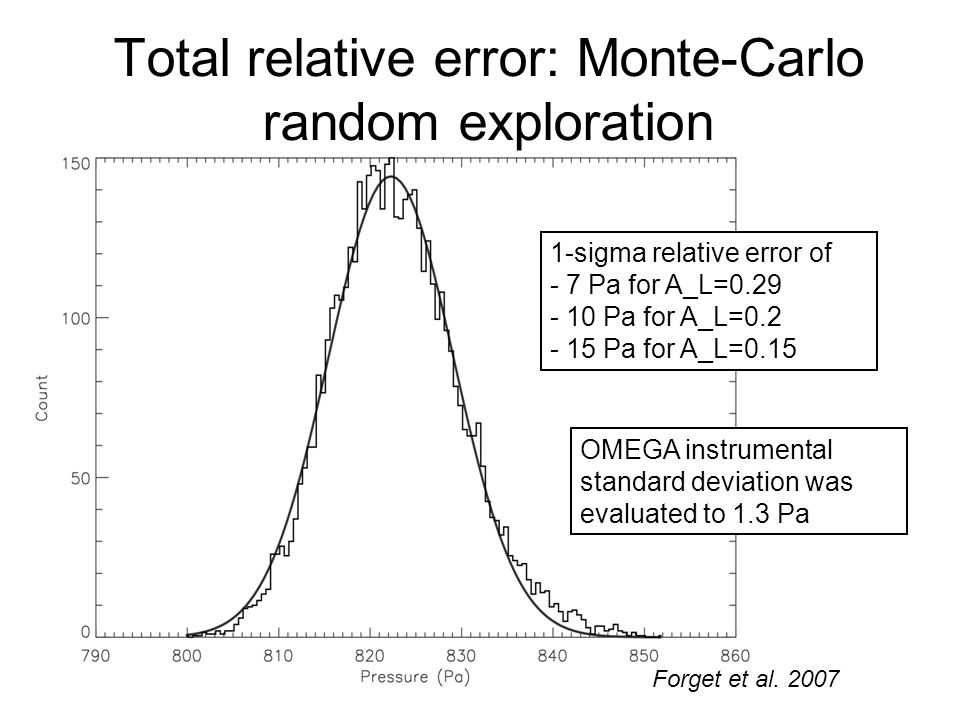
Total relative error: Monte-Carlo random exploration 1-sigma relative error of - 7 Pa for A_L=0.29 - 10 Pa for A_L=0.2 - 15 Pa for A_L=0.15 OMEGA instrumental standard deviation was evaluated to 1.3 Pa Forget et al. 2007
26
Observation of aerosol at solar wavelengths OMEGA : – Nadir : not easy by several methods (Maatanen et al. 2010, Vincendon et al. 2007,2011 : dust brighter than expected ; Doute et al. 2011 use effect on CO2 2µm band at high airmass ) – Limb observations: very promising, but not yet fully analysed (Fouchet et al. 2006, Vincendon et al. 2011 more soon). SPICAM: UV : –limb observations (Rannou et al. 2006) –Stellar occultation (Montmessin et al., 2006) –Solar occultation (Listowski, 2011) SPICAM NIR : solar occultations –Fedorova et al. (2010)
 – Limb observations: very promising, but not yet fully analysed (Fouchet et al. 2006, Vincendon et al more soon). SPICAM: UV : –limb observations (Rannou et al. 2006) –Stellar occultation (Montmessin et al., 2006) –Solar occultation (Listowski, 2011) SPICAM NIR : solar occultations –Fedorova et al. (2010).")
27
27 surface reflectance is 0 at λ = 2.64 µm reflectance factor CO 2 ice wavelength (µm) sun Dust at the south pole Vincendon et al. 2007,2009

28
28 2004 / 20052006 / 2007 Spatial variations of the dust optical depth Vincendon et al. 2009

29
Observation of aerosol at solar wavelengths OMEGA : – Nadir : not easy by several methods (Maatanen et al. 2010, Vincendon et al. 2007,2011 : dust brighter than expected ; Doute et al. 2011 use effect on CO2 2µm band at high airmass ) – Limb observations: very promising, but not yet fully analysed (Fouchet et al. 2006, more soon). SPICAM: UV : –limb observations (Rannou et al. 2006) –Stellar occultation (Montmessin et al., 2006) –Solar occultation (Listowski, 2011) SPICAM NIR : solar occultations –Fedorova et al. (2010)
 – Limb observations: very promising, but not yet fully analysed (Fouchet et al. 2006, more soon). SPICAM: UV : –limb observations (Rannou et al. 2006) –Stellar occultation (Montmessin et al., 2006) –Solar occultation (Listowski, 2011) SPICAM NIR : solar occultations –Fedorova et al. (2010).")
30
Fedorova et al. (2010)
")
31
Simultaneous observations of H 2 O, CO 2 and aerosols 1) H 2 O density from 1.38 m band 2) Atmospheric density from 1.43 m CO 2 band 3) Aerosol extinction profiles and particle size distribution with 10 spectral points outside gaseous absorption bands CO 2 H2OH2O Spectral range:1-1.7 µm Spectral power: Spectral resolution R~2000 0.5-1.2 nm FOV nadir occultation 1° ~0.07° (3.5 km at 3000 km to limb) Aerosol points: dashed lines SPICAM IR – AOTF spectrometer:
 H 2 O density from 1.38 m band 2) Atmospheric density from 1.43 m CO 2 band 3) Aerosol extinction profiles and particle size distribution with 10 spectral points outside gaseous absorption bands CO 2 H2OH2O Spectral range:1-1.7 µm Spectral power: Spectral resolution R~ nm FOV nadir occultation 1° ~0.07° (3.5 km at 3000 km to limb) Aerosol points: dashed lines SPICAM IR – AOTF spectrometer:")
32
Cause: mis-pointing of the real optical axis wrt predicted one Solution: find the altitude shift that gives the best agreement between observed and modeled CO 2 profile Method: weighted mean altitude difference of the profile NOTE: recently studied by Scanning the solar disk in two orthogonal planes with constant θ/φ coordinates wrt. spacecraft body frame etc... = 14.64 km Problem with solar occultation – Pointing Maltagliatti et al.

33
Sun occultation examples of spectra A principle of sequential scanning of a spectrum: short windows and dots Two detectors The record of a spectrum takes 4-6 seconds Vertical resolution is 3.7 km with distance to limb 3000 km A new optimal command for SPICAM IR permitting simultaneous observations of CO 2, H 2 O and aerosol vertical distributions with spectral dependence of aerosol extinction in solar occultation mode was adapted only in April 2006 4 sec 6 sec 4 sec Fedorova et al. (2010)
.")
34
Vertical distribution of r eff Red line is the H 2 O refractive index, blue line is the ‘Marsdust’ model High-altitude cloud with r eff =0.1-0.3 m Northern hemisphere R eff ~0.4-0.8 m assuming a dust R eff ~0.4-1.2 m assuming H 2 O The size gradient has been observed Southern hemisphere Fedorova et al. (2010)
.")
35
Particle size variations with season and latitude r eff, m Fedorova et al. (2010)
")
36
Observation of water ice clouds at solar wavelengths SPICAM UV : Mateshvili et al. (2007) OMEGA NIR : Madeleine et al. (2011): Mars water ice clouds opacity and particle size LIMB observations 36
 OMEGA NIR : Madeleine et al. (2011): Mars water ice clouds opacity and particle size LIMB observations 36.")
37
37 A difficult retrieval using two observations with and without clouds (Madeleine et al. 2011)
")
38
Mars water ice clouds opacity and particle size using OMEGA (Madeleine et al., submitted to JGR)
")
39
CO2 ice clouds

40
Detection of high altitude CO2 ice clouds with OMEGA (Montmessin et al. 2007) Opacity > 0.2 Altitude ~80 km Reff up to 1.5 m First spectroscopic identification by Mars Express (PFS, OMEGA, Formisano et al. 2006, Montmessin et al. 2007) Observations by MOC & TES (Clancy et al. 2007), SPICAM (Montmessin et al. 2006), VMC, THEMIS (McConnochie et al.) Observations by MOC & TES (Clancy et al. 2007), SPICAM (Montmessin et al. 2006), VMC, THEMIS (McConnochie et al.)
 Opacity > 0.2 Altitude ~80 km Reff up to 1.5 m First spectroscopic identification by Mars Express (PFS, OMEGA, Formisano et al. 2006, Montmessin et al. 2007) Observations by MOC & TES (Clancy et al. 2007), SPICAM (Montmessin et al. 2006), VMC, THEMIS (McConnochie et al.) Observations by MOC & TES (Clancy et al. 2007), SPICAM (Montmessin et al. 2006), VMC, THEMIS (McConnochie et al.).")
41
CO2 condensation SPICAM stellar occultation Forget et al. 2009

42
Detached aerosol layer simultaneously in the stellar occultation Montmessin et al., Icarus 2006 CO2 condensation

43
Seasonal evolution map HRSC OMEGA (spicam)
")
44
Mars Express H 2 O measurements PFS spectral resolution 1.4 cm -1 –LW 25-35 µm: processed by 2 groups: Fouchet et al., Icarus 2007 –SW 2.56 µm: processed by 3 groups: Tschimmel et al., Icarus 2008. OMEGA 2.56 µm mapping processed by 2 groups –Encrenaz et al. A&A 2005, 2008 –Melchiorri et al. PSS 2007, Icarus 2009 –Maltagliati et al., 2008; 2009 in press? SPICAM 1.37 µm spectral resolution 3.5 cm -1 processed by one group –Fedorova et al., JGR 2006 Compared to Mars Global Surveyor TES TES 25-50 µm, spectral resolution 6.25 or 12.5 cm -1 Korablev et al. 2009

45
On the difficulty of measuring water vapor : comparison of Mars Express H 2 O measurements SPICAM PFS LW OMEGA PFS SW Korablev et al., ISSI group usually PFS LW ≤ SPICAM ≤ OMEGA ≤ TES ≤ PFS SW

46
Side effects of Mars Express water vapour comparisons TES/MGS database modification –Bug in processing low resolution (12.5 cm -1 ) portion of data –Reduction of H 2 O content in this data by 30% MAWD/Viking dataset modification –Reprocessing of MAWD with new spectroscopic database (HITRAN 2004) –Reduction of the entire dataset by 60% Korablev et al., ISSI group
 portion of data –Reduction of H 2 O content in this data by 30% MAWD/Viking dataset modification –Reprocessing of MAWD with new spectroscopic database (HITRAN 2004) –Reduction of the entire dataset by 60% Korablev et al., ISSI group")
47
Solar occultation water vapor retrieval (Maltagliatti et al. : in revision for Science)
")
48
— Observation — Model fit

49
Solar occultation water vapor retrieval (Maltagliatti et al. : in revision for Science) — Observation — LMD GCM
 — Observation — LMD GCM.")
50
Solar occultation water vapor retrieval (Maltagliatti et al. : in revision for Science)
")
51
Trace Gas Observations –Ozone – O2 –NO –CO –SO2 ? –H2O2 ? –Methane

52
Trace Gas Observations –Ozone Spicam NADIR Spicam stellar occultation

53
Typical duration of obs.30 min Frequency of records1 spectrum/sec Integration time450 ms Field of view at pericenter~ 2 km CO 2 O 3 dust clouds surface SPICAM observations in nadir mode 110-320 nm Ozone Mapping with Spicam

54
SPICAM raw spectra SPICAM geometry lon(t), lat(t), HL(t), L s, SZA(t), (t) (t) Mars Climate Database surface pressure, T profile, O 3 profile Radiative Transfer Model SHDOM 210-300 nm 0-60 km 12 layers Optimal Parameters ozone column albedo at 210 nm albedo at 300 nm dust opacity Correction of dark current and stray light Averaging over 50 s (250 spectra) Division by Data Reference Spectrum Olympus Mons Ls =170° (Orbit 1448) Spectral smoothing (5 nm) Levenberg-Marquardt fit 4 free parameters: ozone column albedo at 210 nm albedo at 300 nm dust opacity 262A01 L s = 13.3 lat = 35° lat = 70° lat = 50° lat = 60°
, lat(t), HL(t), L s, SZA(t), (t) (t) Mars Climate Database surface pressure, T profile, O 3 profile Radiative Transfer Model SHDOM nm 0-60 km 12 layers Optimal Parameters ozone column albedo at 210 nm albedo at 300 nm dust opacity Correction of dark current and stray light Averaging over 50 s (250 spectra) Division by Data Reference Spectrum Olympus Mons Ls =170° (Orbit 1448) Spectral smoothing (5 nm) Levenberg-Marquardt fit 4 free parameters: ozone column albedo at 210 nm albedo at 300 nm dust opacity 262A01 L s = 13.3 lat = 35° lat = 70° lat = 50° lat = 60°")
55
SPICAM Ozone Column polar night spring summer autumn winter Perrier et al., J. Geophys. Res., 2006

56
Analysis of SPICAM ozone columns with the LMD GCM GCM ozone column (micron-atmosphere) Lefèvre et al., Nature, 2008 70N-90N 50N-70N
 Lefèvre et al., Nature, N-90N 50N-70N")
57
winter summer Model Ozone column winter summer O3 profile using SPICAM UV stellar occultation (Lebonnois et al. 2007) Comparison with GCM
 Comparison with GCM.")
58
Trace Gas Observations –O2 O2 florescence (1.27µm) resulting from dayside: –OMEGA nadir and Limb : Altieri et al. 2009; –SPICAM NIR Nadir and Limb Guslyakova et al. 2011; –PFS Geminale et al. 2011 O2 Recombination Nightglow Emission at 1.27 µm –OMEGA/MEX: Bertaux et al. 2011 –SPICAM Guslyakova et al. 2011 )
.")
59
Gravity waves on polar regions as observed by OMEGA with O2 emission Southern late winter/early spring MY28 Northern late winter MY26 Apparent MR Altieri et al. 2009

60
Carbon Monoxide OMEGA (resolution Encrenaz et al. (2006) – CO main line :(2–0) at 2.35 µm PFS – CO main line :(2–0) band centered at 4255 cm−1 (around 2.35 μm) difficult to use because of affected by mechanical vibrations – Billebaud et al. (2009) Billebaud et al. 4.7 μm spectra of Mars ((1–0) ro-vibrationnal) – Sindoni et al. PSS 2011: Measuring CO at 4235cm1 (2.36 µm) branch of (2–0) band
 – CO main line :(2–0) at 2.35 µm PFS – CO main line :(2–0) band centered at 4255 cm−1 (around 2.35 μm) difficult to use because of affected by mechanical vibrations – Billebaud et al. (2009) Billebaud et al. 4.7 μm spectra of Mars ((1–0) ro-vibrationnal) – Sindoni et al. PSS 2011: Measuring CO at 4235cm1 (2.36 µm) branch of (2–0) band.")
61
CO mixing ratio Sindoni et al. PSS 2011 4235cm1 (2.36 µm)
")
62
CO enrichment in Hellas: predicted by GCM, detected by OMEGA (Encrenaz et al. 2006) CO main line :(2–0) at 2.35 µm GCM : % of non condensible gaz OMEGA observations: HELLAS
 CO main line :(2–0) at 2.35 µm GCM : % of non condensible gaz OMEGA observations: HELLAS.")
63
Trace Gas Observations – Ozone – O2 – CO – NO – SO2 : search in the UV with SPICAM UV nadir observations (Marcq et al. 2011) – H2O2 : search in the thermal IR using PFS with line at 362 cm-1 (+ 379, 416 and 433 cm-1). So far inconsistent results (Kasaba, Aoki et al. 2010) – Methane
 – H2O2 : search in the thermal IR using PFS with line at 362 cm-1 (+ 379, 416 and 433 cm-1). So far inconsistent results (Kasaba, Aoki et al. 2010) – Methane.")
64
Methane (PFS: 3018 cm-1) Very difficult detection by Formisano et al. (Science 2004) Further results by the PFS team published recently – A. Geminale, V. Formisano, M. Giuranna. Methane in Martian atmosphere: Average spatial, diurnal,and seasonal behaviour Planetary and Space Science 56 1194–1203(2008) – Geminale, Sindony, Formisano: Mapping methane in Martian atmosphere with PFS-MEX data Planetary and Space Science 59 137– 148 (2011) Enigmatic variability, patchy behaviour Geminale et al. 2008
 Further results by the PFS team published recently – A. Geminale, V. Formisano, M. Giuranna. Methane in Martian atmosphere: Average spatial, diurnal,and seasonal behaviour Planetary and Space Science –1203(2008) – Geminale, Sindony, Formisano: Mapping methane in Martian atmosphere with PFS-MEX data Planetary and Space Science – 148 (2011) Enigmatic variability, patchy behaviour Geminale et al")
65
Geminale et al. 2011

66
Thank you

67
Forget et al. 2007

Similar presentations


, Brekhovskih U.A.(1), Piccioni G.(3), Drossart P.(4). (1) IKI RAS, Moscow, (2) MIPT, Dolgoprudny,>")


 first visit to another planet in the Solar System.>")


