Download presentation
Presentation is loading. Please wait.

1
7 Process Strategy and Sustainability
© 2011 Pearson Education, Inc. publishing as Prentice Hall

2
Process Strategies The objective of a process strategy is to build a production process that meets customer requirements and product specifications within cost and other managerial constraints © 2011 Pearson Education, Inc. publishing as Prentice Hall

3
Process Strategies How to produce a product or provide a service that
Meets or exceeds customer requirements Meets cost and managerial goals Has long term effects on Efficiency and production flexibility Costs and quality © 2011 Pearson Education, Inc. publishing as Prentice Hall

4
Process Strategies Four basic strategies Process focus
Batch production Product focus - Continuous flow - Discrete flow 4. Mass customization © 2011 Pearson Education, Inc. publishing as Prentice Hall

5
Process, Volume, and Variety
Low Volume Repetitive Process High Volume Volume Figure 7.1 High Variety one or few units per run, (allows customization) Process Focus (JOBSHOP Production) Mass Customization (difficult to achieve, but huge rewards) Dell Computer Changes in Modules modest runs, standardized modules Batch Production Changes in Attributes (such as grade, quality, size, thickness, etc.) long runs only Product Focus (Mass Production) Continuous Flow Discrete Flow Poor Strategy (Both fixed and variable costs are high) © 2011 Pearson Education, Inc. publishing as Prentice Hall
 Process Focus (JOBSHOP Production) Mass Customization. (difficult to achieve, but huge rewards) Dell Computer. Changes in Modules. modest runs, standardized modules. Batch Production. Changes in Attributes (such as grade, quality, size, thickness, etc.) long runs only. Product Focus. (Mass Production) Continuous Flow. Discrete Flow. Poor Strategy (Both fixed and variable costs are high) © 2011 Pearson Education, Inc. publishing as Prentice Hall.")
6
Characteristics of Process Types
Dimension Job Shop Batch Discrete Flow Continuous Flow Job variety Very High Moderate Low Very low Process flexibility Unit cost Volume of output Very Low High Very high

7
Process Focus Facilities are organized around specific activities or processes General purpose equipment and skilled personnel High degree of product flexibility Typically high costs and low equipment utilization Product flows may vary considerably making planning and scheduling a challenge © 2011 Pearson Education, Inc. publishing as Prentice Hall

8
Process Focus (Service)
Many inputs (surgeries, sick patients, baby deliveries, emergencies) Many different outputs (uniquely treated patients) Many departments and many routings (low volume, high variety, intermittent processes) Arnold Palmer Hospital Figure 7.2(a) © 2011 Pearson Education, Inc. publishing as Prentice Hall
 Many different outputs (uniquely treated patients) Many departments and many routings. (low volume, high variety, intermittent processes) Arnold Palmer Hospital. Figure 7.2(a) © 2011 Pearson Education, Inc. publishing as Prentice Hall.")
9
Process Focus allows a flexible flow between stations (Manufacturing)
Gear cutting Mill Drill Lathes Grind Heat treat Assembly 111 333 222 444 1111 2222 3333 44444 333333 22222

10
Repetitive Focus Facilities often organized as assembly lines
Characterized by modules with parts and assemblies made previously Modules may be combined for many output options Less flexibility than process-focused facilities but more efficient © 2011 Pearson Education, Inc. publishing as Prentice Hall

11
Repetitive Focus (modular) Harley Davidson
Raw materials and module inputs Modules combined for many Output options (many combinations of motorcycles) Few modules (multiple engine models, wheel modules) (modular) Harley Davidson Figure 7.2(b) © 2011 Pearson Education, Inc. publishing as Prentice Hall
 Few modules. (multiple engine models, wheel modules) (modular) Harley Davidson. Figure 7.2(b) © 2011 Pearson Education, Inc. publishing as Prentice Hall.")
12
Product Focus Facilities are organized by product
High volume but low variety of products Long, continuous production runs enable efficient processes Typically high fixed cost but low variable cost Generally less skilled labor © 2011 Pearson Education, Inc. publishing as Prentice Hall

13
Product Focus Raw materials Finished item or customer
Station 1 Station 2 Station 3 Station 4 Finished item Material and/or labor Material and/or labor Material and/or labor Material and/or labor Used for Repetitive or Continuous Processing

14
Product Focus (low-volume, high variety, continuous process) Frito-Lay
Few Inputs (corn, potatoes, water, seasoning) Output variations in size, shape, and packaging (3-oz, 5-oz, 24-oz package labeled for each material) (low-volume, high variety, continuous process) Frito-Lay Figure 7.2(c) © 2011 Pearson Education, Inc. publishing as Prentice Hall
 Output variations in size, shape, and packaging. (3-oz, 5-oz, 24-oz package labeled for each material) (low-volume, high variety, continuous process) Frito-Lay. Figure 7.2(c) © 2011 Pearson Education, Inc. publishing as Prentice Hall.")
15
Hot mill for finishing, cooling, and coiling
Product Focus Scrap steel Ladle of molten steel Electric furnace A B C Continuous caster Continuous cast steel sheared into 24-ton slabs Hot tunnel furnace ft Hot mill for finishing, cooling, and coiling D E F G H I Nucor Steel Plant © 2011 Pearson Education, Inc. publishing as Prentice Hall

16
Mass Customization The fast, low-cost production of goods and services to satisfy increasingly unique customer desires Combines the flexibility of a process focus with the efficiency of a product focus by using automated manufacturing technologies © 2011 Pearson Education, Inc. publishing as Prentice Hall

17
Mass Customization Number of Choices Item 1970s 21st Century
Vehicle models Vehicle types 18 1,212 Bicycle types ,000 Software titles 0 400,000 Web sites ,000,000 Movie releases per year New book titles 40, ,000 Houston TV channels 5 185 Breakfast cereals Items (SKUs) in 14, ,000 supermarkets LCD TVs Number of Choices Item 1970s 21st Century Table 7.1 © 2011 Pearson Education, Inc. publishing as Prentice Hall
 in 14, ,000. supermarkets. LCD TVs Number of Choices. Item 1970s 21st Century. Table 7.1. © 2011 Pearson Education, Inc. publishing as Prentice Hall.")
18
Mass Customization (high-volume, high-variety) Dell Computer
Many parts and component inputs Many output versions (custom PCs and notebooks) Many modules (chips, hard drives, software, cases) (high-volume, high-variety) Dell Computer Figure 7.2(d) © 2011 Pearson Education, Inc. publishing as Prentice Hall
 Many modules. (chips, hard drives, software, cases) (high-volume, high-variety) Dell Computer. Figure 7.2(d) © 2011 Pearson Education, Inc. publishing as Prentice Hall.")
19
Requirements to Achieve Mass Customization
Repetitive Focus Flexible people and equipment Figure 7.3 Modular techniques Accommodating Product and Process Design Responsive Supply Chains Mass Customization Rapid throughput techniques Effective scheduling techniques Process-Focused High variety, low volume Low utilization (5% to 25%) General-purpose equipment Product-Focused Low variety, high volume High utilization (70% to 90%) Specialized equipment © 2011 Pearson Education, Inc. publishing as Prentice Hall
 General-purpose equipment. Product-Focused. Low variety, high volume. High utilization (70% to 90%) Specialized equipment. © 2011 Pearson Education, Inc. publishing as Prentice Hall.")
20
Mass Customization/Built-to-Order
Imaginative and fast product design (CAD) Flexible process design (FMS) Tightly controlled inventory management (ERP) Tight schedules to deliver the products on-time Responsive and collabarative supply chain partners © 2011 Pearson Education, Inc. publishing as Prentice Hall
 Flexible process design (FMS) Tightly controlled inventory management (ERP) Tight schedules to deliver the products on-time. Responsive and collabarative supply chain partners. © 2011 Pearson Education, Inc. publishing as Prentice Hall.")
21
Comparison of Process Types
Process Focus (low-volume, high-variety) Repetitive Focus (modular) Product Focus (high-volume, low-variety) Mass Customization (high-volume, high-variety) Small quantity and large variety of products are produced Long runs, usually a standardized product with options, produced from modules Large quantity and small variety of products are produced Large quantity and large variety of products are produced Equipment used is general purpose Special equipment aids in use of an assembly line Equipment used is special purpose Rapid changeover on flexible equipment Table 7.2 © 2011 Pearson Education, Inc. publishing as Prentice Hall
 Repetitive Focus. (modular) Product Focus. (high-volume, low-variety) Mass Customization. (high-volume, high-variety) Small quantity and large variety of products are produced. Long runs, usually a standardized product with options, produced from modules. Large quantity and small variety of products are produced. Large quantity and large variety of products are produced. Equipment used is general purpose. Special equipment aids in use of an assembly line. Equipment used is special purpose. Rapid changeover on flexible equipment. Table 7.2. © 2011 Pearson Education, Inc. publishing as Prentice Hall.")
22
Comparison of Processes
Process Focus (low-volume, high-variety) Repetitive Focus (modular) Product Focus (high-volume, low-variety) Mass Customization (high-volume, high-variety) Operators are broadly skilled Employees are modestly trained Operators are less broadly skilled Flexible operators are trained for the necessary customization There are many job instructions because each job changes Repetitive operations reduce training and changes in job instructions Work orders and job instructions are few because they are standardized Custom orders require many job instructions Table 7.2 © 2011 Pearson Education, Inc. publishing as Prentice Hall
 Repetitive Focus. (modular) Product Focus. (high-volume, low-variety) Mass Customization. (high-volume, high-variety) Operators are broadly skilled. Employees are modestly trained. Operators are less broadly skilled. Flexible operators are trained for the necessary customization. There are many job instructions because each job changes. Repetitive operations reduce training and changes in job instructions. Work orders and job instructions are few because they are standardized. Custom orders require many job instructions. Table 7.2. © 2011 Pearson Education, Inc. publishing as Prentice Hall.")
23
Comparison of Processes
Process Focus (low-volume, high-variety) Repetitive Focus (modular) Product Focus (high-volume, low-variety) Mass Customization (high-volume, high-variety) Raw-material inventories high relative to the value of the product JIT procurement techniques are used Raw material inventories are low relative to the value of the product Work-in-process is high compared to output JIT inventory techniques are used Work-in-process inventory is low compared to output Work-in-process inventory driven down by JIT, kanban, lean production Table 7.2 © 2011 Pearson Education, Inc. publishing as Prentice Hall
 Repetitive Focus. (modular) Product Focus. (high-volume, low-variety) Mass Customization. (high-volume, high-variety) Raw-material inventories high relative to the value of the product. JIT procurement techniques are used. Raw material inventories are low relative to the value of the product. Work-in-process is high compared to output. JIT inventory techniques are used. Work-in-process inventory is low compared to output. Work-in-process inventory driven down by JIT, kanban, lean production. Table 7.2. © 2011 Pearson Education, Inc. publishing as Prentice Hall.")
24
Comparison of Processes
Process Focus (low-volume, high-variety) Repetitive Focus (modular) Product Focus (high-volume, low-variety) Mass Customization (high-volume, high-variety) Units move slowly through the facility Assembly is measured in hours and days Swift movement of units through the facility is typical Goods move swiftly through the facility Finished goods are usually made to order and not stored Finished goods made to forecast Finished goods are usually made to forecast and stored Finished goods are often build-to-order (BTO) Table 7.2 © 2011 Pearson Education, Inc. publishing as Prentice Hall
 Repetitive Focus. (modular) Product Focus. (high-volume, low-variety) Mass Customization. (high-volume, high-variety) Units move slowly through the facility. Assembly is measured in hours and days. Swift movement of units through the facility is typical. Goods move swiftly through the facility. Finished goods are usually made to order and not stored. Finished goods made to forecast. Finished goods are usually made to forecast and stored. Finished goods are often build-to-order (BTO) Table 7.2. © 2011 Pearson Education, Inc. publishing as Prentice Hall.")
25
Comparison of Processes
Process Focus (low-volume, high-variety) Repetitive Focus (modular) Product Focus (high-volume, low-variety) Mass Customization (high-volume, high-variety) Scheduling is complex, concerned with trade-offs between inventory, capacity, and customer service Scheduling is based on building various models from a variety of modules to forecasts Scheduling is relatively simple, concerned with establishing output rate sufficient to meet forecasts Sophisticated scheduling is required to accommodate custom orders Fixed costs tend to be low and variable costs high Fixed costs dependent on flexibility of the facility Fixed costs tend to be high and variable costs low Fixed costs tend to be high, variable costs must be low Table 7.2 © 2011 Pearson Education, Inc. publishing as Prentice Hall
 Repetitive Focus. (modular) Product Focus. (high-volume, low-variety) Mass Customization. (high-volume, high-variety) Scheduling is complex, concerned with trade-offs between inventory, capacity, and customer service. Scheduling is based on building various models from a variety of modules to forecasts. Scheduling is relatively simple, concerned with establishing output rate sufficient to meet forecasts. Sophisticated scheduling is required to accommodate custom orders. Fixed costs tend to be low and variable costs high. Fixed costs dependent on flexibility of the facility. Fixed costs tend to be high and variable costs low. Fixed costs tend to be high, variable costs must be low. Table 7.2. © 2011 Pearson Education, Inc. publishing as Prentice Hall.")
26
Comparing Cost of Process Types Using Crossover Charts
Three Accounting Software Products Total Fixed Cost Dollars Required per Accounting Report Software A $200000 $60 Software B $300000 $25 Software C $400000 $10 © 2011 Pearson Education, Inc. publishing as Prentice Hall

27
Comparing Cost of Process Types Using Crossover Charts
Fixed costs Variable costs ($60) $ Low volume, high variety Process A Fixed costs Variable costs($25) $ Repetitive Process B Fixed costs Variable ($10) costs $ High volume, low variety Process C Total cost Total cost Total cost 400,000 300,000 200,000 Volume $ V2 (6,666) V1 (2,857) Fixed cost Process C Fixed cost Process B Fixed cost Process A Figure 7.4 © 2011 Pearson Education, Inc. publishing as Prentice Hall
 $ Low volume, high variety. Process A. Fixed costs. Variable costs($25) $ Repetitive. Process B. Fixed costs. Variable ($10) costs. $ High volume, low variety. Process C. Total cost. Total cost. Total cost. 400, , ,000. Volume. $ V2. (6,666) V1. (2,857) Fixed cost Process C. Fixed cost Process B. Fixed cost Process A. Figure 7.4. © 2011 Pearson Education, Inc. publishing as Prentice Hall.")
28
Focused Processes Focus can be Customers Products Service Technology
Quality Focus brings Less overhead costs Less complexity More efficiency © 2011 Pearson Education, Inc. publishing as Prentice Hall

29
Changing Processes Difficult and expensive May mean starting over
Process strategy determines transformation strategy for an extended period Important to get it right © 2011 Pearson Education, Inc. publishing as Prentice Hall

30
Questions to Ask When Analyzing and Designing Processes
Is the process designed to achieve a competitive advantage? Does the process eliminate steps that do not add value? Does the process maximize customer value? Will the process win orders? © 2011 Pearson Education, Inc. publishing as Prentice Hall

31
Five Tools That Help to Understand Processes
Flow Charts - Shows the movement of materials, product or people Time-Function Mapping - Shows flows and time frame Value-Stream Mapping - Shows flows and time and value added in the entire production process including the supply chain Process Charts - Uses symbols to show key activities and helps to focus on value-added activities Service Blueprinting - focuses on customer/provider interaction © 2011 Pearson Education, Inc. publishing as Prentice Hall

32
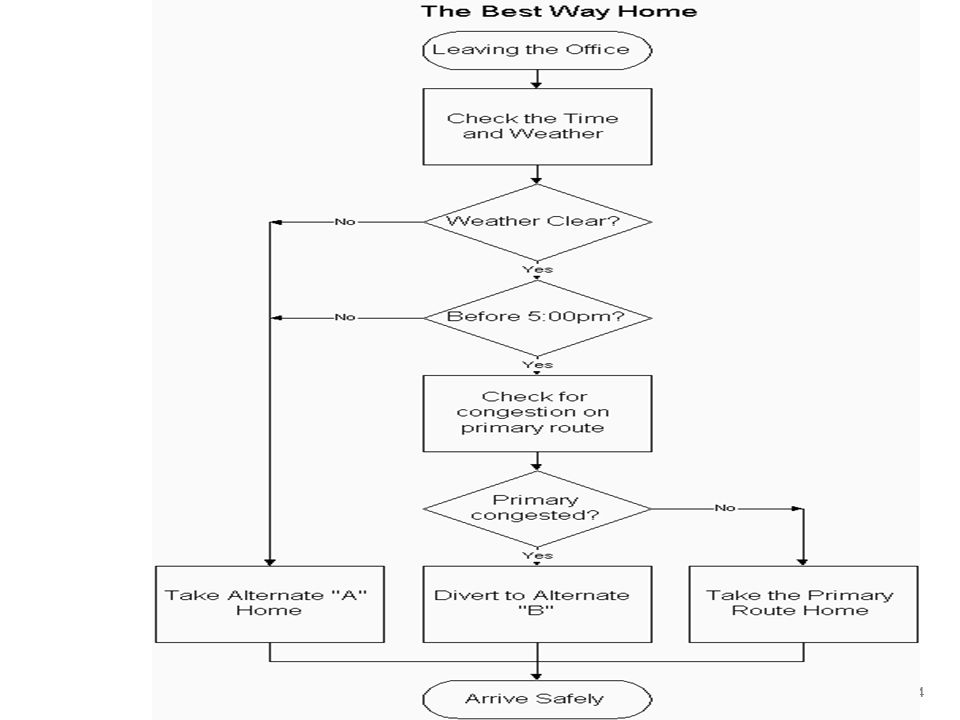
Process strategies MGT 301 Flow Charts One of the fundamental graphical tools for process analysis and design Typically depicts activities sequentially from left to right Can help to identify, loops, multiple alternative paths, decision points etc. Symbols to use in flow charting Operation Transportation of a physical item Storage Inspection Transportation of information Delay Ch 7

33
Illustration of a Sample Flow Chart
Operator takes phone order. Orders wait to be picked up. Supervisor inspects orders. Order is fulfilled. Order waits for sales rep. Is order complete? Yes No Orders are moved to supervisor’s in-box. Orders wait for supervisor.

35
“Current” Time-Function Map
Customer Sales Production control Plant A Warehouse Plant B Transport Order product Process order Wait Order Move Receive product Product Print Wait Order WIP Extrude Wait WIP Product Move Wait WIP 12 days 13 days 1 day 4 days 10 days 0 day 52 days Figure 7.5 © 2011 Pearson Education, Inc. publishing as Prentice Hall

36
“Target” Time-Function Map
Customer Sales Production control Plant Warehouse Transport Order product Process order Wait Order Move Receive product Product Extrude Wait Print Order WIP Product 1 day 2 days 6 days Figure 7.5 © 2011 Pearson Education, Inc. publishing as Prentice Hall

37
Value-Stream Mapping Figure 7.6
© 2011 Pearson Education, Inc. publishing as Prentice Hall

38
Process Chart Figure 7.7 © 2011 Pearson Education, Inc. publishing as Prentice Hall

39
Service Blueprinting Focuses on the customer and service provider interaction Defines three levels of interaction Each level has different management issues Identifies potential failure points © 2011 Pearson Education, Inc. publishing as Prentice Hall

40
Service Blueprint Defines three levels of interaction
Process strategies MGT 301 Service Blueprint Defines three levels of interaction Activities under the control of the customer Interaction between the customer and service provider Activities performed invisibly to the customer Ch 7

41
Service Blueprint Figure 7.8 Personal Greeting Service Diagnosis
Perform Service Friendly Close Customer arrives for service. (3 min) Warm greeting and obtain service request. (10 sec) F Level #1 Notify customer the car is ready. (3 min) Customer departs Customer pays bill. (4 min) F Perform required work. (varies) Prepare invoice. No Notify customer and recommend an alternative provider. (7min) Standard request. (3 min) Determine specifics. (5 min) No Can service be done and does customer approve? Yes F Level #2 Direct customer to waiting room. F Yes F Level #3 Figure 7.8 © 2011 Pearson Education, Inc. publishing as Prentice Hall
 Warm greeting and obtain service request. (10 sec) F. Level. #1. Notify customer the car is ready. (3 min) Customer departs. Customer pays bill. (4 min) F. Perform required work. (varies) Prepare invoice. No. Notify customer and recommend an alternative provider. (7min) Standard request. (3 min) Determine specifics. (5 min) No. Can service be done and does customer approve Yes. F. Level. #2. Direct customer to waiting room. F. Yes. F. Level. #3. Figure 7.8. © 2011 Pearson Education, Inc. publishing as Prentice Hall.")
42
Special Considerations for Service Process Design
Some interaction with customer is necessary, but this often affects performance adversely The better these interactions are accommodated in the process design, the more efficient and effective the process Find the right combination of cost and customer interaction © 2011 Pearson Education, Inc. publishing as Prentice Hall

43
Service Process Matrix
Service Factory Service Shop Degree of Customization Low High Degree of Labor Mass Service Professional Service Commercial banking Private banking Digital orthodontics Traditional orthodontics General- purpose law firms Law clinics Full-service stockbroker Limited-service stockbroker Retailing Boutiques Warehouse and catalog stores Specialized hospitals Hospitals Fast-food restaurants Fine-dining restaurants Airlines No-frills airlines Figure 7.9 © 2011 Pearson Education, Inc. publishing as Prentice Hall

44
Service Process Matrix
Mass Service and Professional Service Labor involvement is high Selection and training highly important Focus on human resources Personalized services © 2011 Pearson Education, Inc. publishing as Prentice Hall

45
Service Process Matrix
Service Factory and Service Shop Automation of standardized services Low labor intensity responds well to process technology and scheduling Tight control required to maintain standards © 2011 Pearson Education, Inc. publishing as Prentice Hall

46
Improving Service Productivity
Strategy Technique Example Separation Structure service so customers must go where the service is offered Bank customers go to a manager to open a new account, to loan officers for loans, and to tellers for deposits Self-service Self-service so customers examine, compare, and evaluate at their own pace Supermarkets and department stores Internet ordering Table 7.3 © 2011 Pearson Education, Inc. publishing as Prentice Hall

47
Improving Service Productivity
Strategy Technique Example Postponement Customizing at delivery Customizing vans at delivery rather than at production Focus Restricting the offerings Limited-menu restaurant Modules Modular selection of service Modular production Investment and insurance selection Prepackaged food modules in restaurants Table 7.3 © 2011 Pearson Education, Inc. publishing as Prentice Hall

48
Improving Service Productivity
Strategy Technique Example Automation Separating services that may lend themselves to some type of automation Automatic teller machines Scheduling Precise personnel scheduling Scheduling ticket counter personnel at 15-minute intervals at airlines Training Clarifying the service options Explaining how to avoid problems Investment counselor, funeral directors After-sale maintenance personnel Table 7.3 © 2011 Pearson Education, Inc. publishing as Prentice Hall

49
Improving Service Processes
Layout Product exposure (restaurants, banks, grocery stores) Human Resources Recruiting and training Cross-trained employees for flexibility © 2011 Pearson Education, Inc. publishing as Prentice Hall
 Human Resources. Recruiting and training. Cross-trained employees for flexibility. © 2011 Pearson Education, Inc. publishing as Prentice Hall.")
50
Technologies to Improve Production and Productivity
Machine technology Automatic identification systems (AISs) Process control Vision system Robots Automated storage and retrieval systems (ASRSs) Automated guided vehicles (AGVs) Flexible manufacturing systems (FMSs) Computer-integrated manufacturing (CIM) © 2011 Pearson Education, Inc. publishing as Prentice Hall
 Process control. Vision system. Robots. Automated storage and retrieval systems (ASRSs) Automated guided vehicles (AGVs) Flexible manufacturing systems (FMSs) Computer-integrated manufacturing (CIM) © 2011 Pearson Education, Inc. publishing as Prentice Hall.")
51
Machine Technology Using Computer Numerical Control (CNC)
Machinery (Machinery with its own computer and memory) for: Increased precision Increased productivity Increased flexibility Improved environmental impact Reduced changeover time Reduced power requirements © 2011 Pearson Education, Inc. publishing as Prentice Hall
 for: Increased precision. Increased productivity. Increased flexibility. Improved environmental impact. Reduced changeover time. Reduced power requirements. © 2011 Pearson Education, Inc. publishing as Prentice Hall.")
52
Automatic Identification Systems (AISs)
Improved data acquisition Reduced data entry errors Increased speed Increased scope of process automation Example – Bar codes and RFID © 2011 Pearson Education, Inc. publishing as Prentice Hall

53
Process Control Real-time monitoring and control of processes by using
Information Technology Sensors collect data Devices read data on periodic basis Measurements translated into digital signals then sent to a computer Computer programs analyze the data Resulting output may take numerous forms © 2011 Pearson Education, Inc. publishing as Prentice Hall

54
Vision Systems Particular aid to automated inspection
Consistently accurate Never bored Modest cost Superior to individuals performing the same tasks © 2011 Pearson Education, Inc. publishing as Prentice Hall

55
Robots Perform monotonous or dangerous tasks
Perform tasks requiring significant strength or endurance Generally enhanced consistency and accuracy © 2011 Pearson Education, Inc. publishing as Prentice Hall

56
Automated Storage and Retrieval Systems (ASRSs)
Automated placement and withdrawal of parts and products Reduced errors and labor Particularly useful in inventory and test areas of manufacturing firms © 2011 Pearson Education, Inc. publishing as Prentice Hall

57
Illustrated concept of a high-rise AS/RS warehouse
AS/RS High-Rise Warehouse

58
Automated Guided Vehicle (AGVs)
Electronically guided and controlled carts Used for movement of products and/or individuals © 2011 Pearson Education, Inc. publishing as Prentice Hall

59
Flexible Manufacturing Systems (FMSs)
Computer controls both the workstation and the material handling equipment Enhance flexibility and reduced waste Can economically produce low volume at high quality Reduced changeover time and increased utilization Stringent communication requirement between components © 2011 Pearson Education, Inc. publishing as Prentice Hall

60
Flexible Manufacturing System
A schematic illustration of a flexible manufacturing system showing machining centers, a measuring and inspection station. And automated guided vehicles. Source: After J. T. Black. Manufacturing, Engineering & Technology, Fifth Edition, by Serope Kalpakjian and Steven R. Schmid. ISBN © 2006 Pearson Education, Inc., Upper Saddle River, NJ. All rights reserved.

61
General View of Flexible Manufacturing System
A general view of a flexible manufacturing system in a plant showing several machining centers and automated guided vehicles moving along the white line in the aisle. Source: Courtesy of Cincinnati Miacron, Inc. Manufacturing, Engineering & Technology, Fifth Edition, by Serope Kalpakjian and Steven R. Schmid. ISBN © 2006 Pearson Education, Inc., Upper Saddle River, NJ. All rights reserved.

62
Computer-Integrated Manufacturing (CIM)
Extension of flexible manufacturing systems Backwards to engineering and inventory control Forward into warehousing and shipping Can also include financial and customer service areas Reducing the distinction between low-volume/high-variety, and high-volume/low-variety production © 2011 Pearson Education, Inc. publishing as Prentice Hall

63
Computer-Integrated Manufacturing (CIM)
Figure 7.10 © 2011 Pearson Education, Inc. publishing as Prentice Hall

64
Process Redesign The fundamental rethinking of business processes to bring about dramatic improvements in performance Relies on reevaluating the purpose of the process and questioning both the purpose and the underlying assumptions Requires reexamination of the basic process and its objectives Focuses on activities that cross functional lines Any process is a candidate for redesign © 2011 Pearson Education, Inc. publishing as Prentice Hall

65
Sustainability in Production Processes (Four Rs)
Resources used by production processes Recycling of production material and components Regulations that apply Reputation of the company © 2011 Pearson Education, Inc. publishing as Prentice Hall

66
Sustainability Resources Recycling Operations is primary user
Reducing use is win-win Recycling Burn, bury, or reuse waste Recycling begins at design © 2011 Pearson Education, Inc. publishing as Prentice Hall

67
Sustainability Regulations Reputation
Laws affect transportation, waste, and noise Increasing regulatory pressure Reputation Leadership may be rewarded Bad reputation can have negative consequences © 2011 Pearson Education, Inc. publishing as Prentice Hall

Similar presentations