Download presentation
Presentation is loading. Please wait.

1
Optimizing Nitrogen and Irrigation Timing for Corn Fertigation Applications Using Remote Sensing Ray Asebedo, David Mengel, and Randall Nelson Kansas State University Manhattan, KS

2
Objectives Measure the impact of the relationship between irrigation timing, N rate, and timing of N application with corn grain yield Evaluate the potential for developing algorithms designed for fertigation systems

3
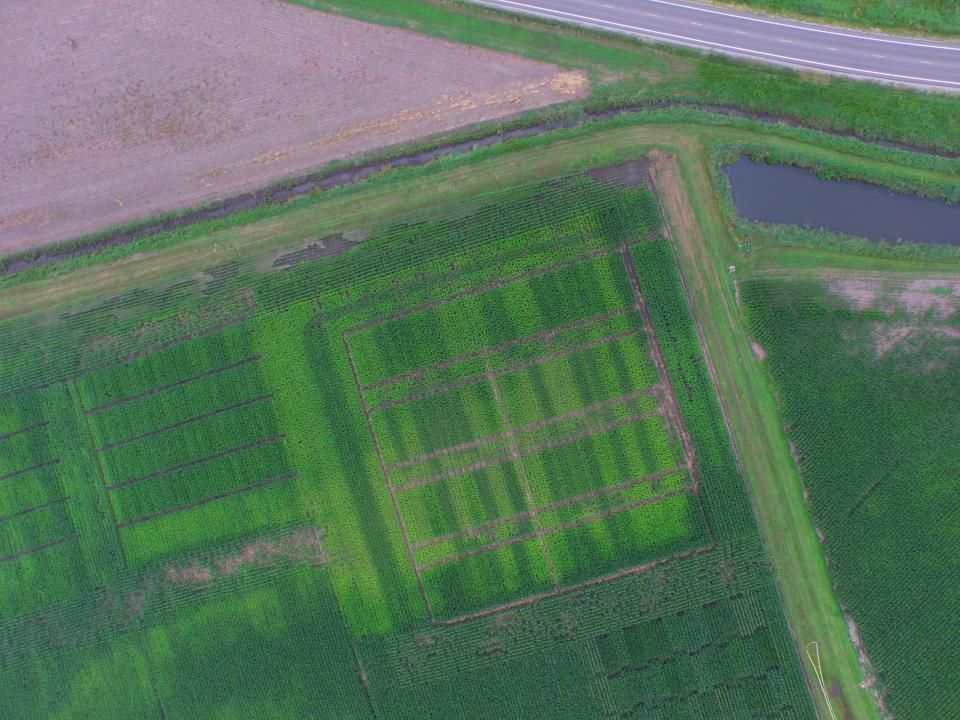
Experimental Design Research plots 10’x40’ Randomized complete block design Four replications Two irrigated sites at KSU experiment fields One flood irrigation site with farmer cooperation in 2012 only

4
Treatment Protocol, 2012 TreatmentN SourceStarter NPre-Plant NIn-Season N RateTotal N Rate 1Urea20800100 2Urea201600180 3Urea202500270 4UAN204040 V4100 5UAN208080 V4180 6UAN20125125 V4270 7UAN2040Sensor60+Sensor 8UAN2080Sensor100+Sensor 9UAN20125Sensor145+Sensor 10Check20N/A

5
Treatment Protocol, 2013-14 Total N Rate Reduced TreatmentN SourceStarter NPre-Plant NIn-Season N RateTotal N Rate 1Urea2060080 2Urea201200140 3Urea201800200 4UAN203030 V480 5UAN206060 V4140 6UAN209090 V4200 7UAN2040Sensor60+Sensor 8UAN2080Sensor100+Sensor 9UAN20120Sensor140+Sensor 10Check20N/A

6
Sampling Methods 0-6” and 0-24” soil samples prior to planting Irrigation scheduling made with KanSched2 Canopy reflectance measured at multiple growth stages Optical Sensor utilized, Trimble Greenseeker V-10 and R-1 Tucker and Mengel(2010) algorithm utilized for sensor based N recommendations Harvested with plot combine at KSU Experiment fields. Hand harvested at farmer fields Combine harvest area, 5’x40’ Hand harvest area, 5’x17.5’

7
Site Information, Scandia Station Year201220132014 Soil TypeCrete silt loam Previous CropSoybeans Tillage PracticeRidge Till Corn HybridNA Pioneer P1602 Plant Population (plants/ac)300002950033500 Irrigation TypeLateral Planting Date4/27/20125/16/20135/5/2014 Second Treatment V-46/4/20126/19/20136/19/2014 Third Treatment V-8 through V-106/14/20127/3/2013NA Last Treatment V-16 through R-16/28/2012NA8/4/2014 Harvest Date10/24/201211/1/201311/11/2014
 Irrigation TypeLateral Planting Date4/27/20125/16/20135/5/2014 Second Treatment V-46/4/20126/19/20136/19/2014 Third Treatment V-8 through V-106/14/20127/3/2013NA Last Treatment V-16 through R-16/28/2012NA8/4/2014 Harvest Date10/24/201211/1/201311/11/2014")
8
Site Information, Scandia Site 2 Year2012 Soil TypeCarr Fine Sandy loam Previous CropSoybeans Tillage PracticeRidge Till Corn HybridNA Plant Population (plants/ac)32000 Irrigation TypeFlood Planting Date4/27/2012 Second Treatment V-46/4/2012 Third Treatment V-86/14/2012 Last Treatment V-166/26/2012 Harvest Date9/25/2012
32000 Irrigation TypeFlood Planting Date4/27/2012 Second Treatment V-46/4/2012 Third Treatment V-86/14/2012 Last Treatment V-166/26/2012 Harvest Date9/25/2012")
9
Site Information, Rossville Station Year20132014 Soil TypeEudora sandy loam Previous CropSoybeans Tillage PracticeConventional Corn HybridPioneer 0876Producers Hybrid 7224 VT3 Plant Population (plants/ac)32000 IrrigationLateral Planting Date4/29/20134/23/2014 Second Treatment V-46/3/20136/6/2014 Third Treatment V-106/25/2013NA Last Treatment V-16 through R-1NA7/8/2014 Harvest Date9/23/20139/17/2014
32000 IrrigationLateral Planting Date4/29/20134/23/2014 Second Treatment V-46/3/20136/6/2014 Third Treatment V-106/25/2013NA Last Treatment V-16 through R-1NA7/8/2014 Harvest Date9/23/20139/17/2014")
10
Results: By Site and By Year

11
2012, Scandia Site 2 Farmer Cooperative Field TreatmentTiming Method Starter N (lb/a) Preplant N (lb/a) In-Season N (lb/a)Total N Applied (lb/a) Yield (bu/a) LSD Grouping 4Pre-plant/V42040 100209A 9Pre-plant/Sensor2012530175209ABC 1Pre-plant2060080203ABC 2Pre-plant201400160201ABC 3Pre-plant202300250199ABC 7Pre-plant/Sensor204094154199ABC 8Pre-plant/Sensor208086186198ABC 5Pre-plant/V42080 180197BC 6Pre-plant/V420105 230193C 10Check2000 193C Treatments with same letter are not statistically different at an 0.05 alpha
 Preplant N (lb/a) In-Season N (lb/a)Total N Applied (lb/a) Yield (bu/a) LSD Grouping 4Pre-plant/V A 9Pre-plant/Sensor ABC 1Pre-plant ABC 2Pre-plant ABC 3Pre-plant ABC 7Pre-plant/Sensor ABC 8Pre-plant/Sensor ABC 5Pre-plant/V BC 6Pre-plant/V C 10Check C Treatments with same letter are not statistically different at an 0.05 alpha")
12
2012, Scandia Site 2 Farmer Cooperative Field

13
Approximately 60 pounds of N per acre was applied through the irrigation water Low response to applied N Site not utilized after 2012 due to high NO3-N in irrigation water Sensor treatments over applied N

14
2012, Scandia Station TreatmentTiming Method Starter N (lb/a) Preplant N (lb/a) In-Season N (lb/a) Total N Applied (lb/a) Yield (bu/a) LSD Grouping 6Preplant/V420105 230188A 5Preplant/V42080 180187A 3Preplant202300250185A 9Preplant/Sensor2012586231185A 8Preplant/Sensor208044144173B 2Preplant201400160166BC 7Preplant/Sensor204091151166BC 1Preplant2060080156C 4Preplant/V42040 100138D 10Check2000 119E Treatments with same letter are not statistically different at an 0.05 alpha
 Preplant N (lb/a) In-Season N (lb/a) Total N Applied (lb/a) Yield (bu/a) LSD Grouping 6Preplant/V A 5Preplant/V A 3Preplant A 9Preplant/Sensor A 8Preplant/Sensor B 2Preplant BC 7Preplant/Sensor BC 1Preplant C 4Preplant/V D 10Check E Treatments with same letter are not statistically different at an 0.05 alpha")
15
2012, Scandia Station

16
Split N applications Preplant/V-4 achieved highest yield 187 bu/ac at 180 lbs N/ac Preplant treatment required 230 lb N/ac to be statistically equal to highest yielding Split treatments Sensor treatment with 125 lb N/ac at Preplant was able achieve high yield but overestimated N need to attain it

17
2013, Scandia Station TreatmentTiming Method Starter N (lb/a) Preplant N (lb/a) In-Season N (lb/a) Total N Applied (lb/a) Yield (bu/a) LSD Grouping 5Preplant/V42060 140179A 8Pre-plant/Sensor208087187177AB 4Preplant/V42030 80176AB 3Pre-plant201800200173AB 6Preplant/V42090 200172AB 7Pre-plant/Sensor2040123183172AB 2Pre-plant201200140170AB 9Pre-plant/Sensor20120133273169AB 1Pre-plant2060080167B 10Check2000 149C Treatments with same letter are not statistically different at an 0.05 alpha
 Preplant N (lb/a) In-Season N (lb/a) Total N Applied (lb/a) Yield (bu/a) LSD Grouping 5Preplant/V A 8Pre-plant/Sensor AB 4Preplant/V AB 3Pre-plant AB 6Preplant/V AB 7Pre-plant/Sensor AB 2Pre-plant AB 9Pre-plant/Sensor AB 1Pre-plant B 10Check C Treatments with same letter are not statistically different at an 0.05 alpha")
18
2013, Scandia Station

19
Overall yields were lower than expected at 179 bu/ac. Expected yields were 250 bu/ac. Likely due to late planting Low response to applied N Primary response was to total N rate Conditions were conducive for mineralization of N Sensor treatments achieved highest yield group but overestimated the N requirements

20
2013, Rossville Station TreatmentTiming Method Starter N (lb/a) Preplant N (lb/a) In-Season N (lb/a) Total N Applied (lb/a) Yield (bu/a) LSD Grouping 8Pre-plant/Sensor080144224148A 7Pre-plant/Sensor040212252148A 9Pre-plant/Sensor0120149269144AB 6Preplant/V4090 180139AB 5Preplant/V4060 120135ABC 2Pre-plant01200 127ABC 3Pre-plant01800 123BC 4Preplant/V4030 60116CD 1Pre-plant0600 96D 10Check000070E Treatments with same letter are not statistically different at an 0.05 alpha
 Preplant N (lb/a) In-Season N (lb/a) Total N Applied (lb/a) Yield (bu/a) LSD Grouping 8Pre-plant/Sensor A 7Pre-plant/Sensor A 9Pre-plant/Sensor AB 6Preplant/V AB 5Preplant/V ABC 2Pre-plant ABC 3Pre-plant BC 4Preplant/V CD 1Pre-plant D 10Check000070E Treatments with same letter are not statistically different at an 0.05 alpha")
21
2013, Rossville Station

22
Significant response to applied N Soil is a deep sandy loam and incurred frequent leaching events, lowering overall yield ranging from 70-148 bu/ac Sensor treatments generated the highest yields but only statistically different from lower rate preplant treatments Results indicate fertigation systems may need to make frequent low rate N applications to satisfy N demand despite water requirements being met or exceeded

23
2014, Rossville Station TreatmentTiming Method Starter N (lb/a) Preplant N (lb/a) In-Season N (lb/a) Total N Applied (lb/a) Yield (bu/a) LSD Grouping 2Pre-plant01200 257A 6Preplant/V4090 180254AB 5Preplant/V4060 120248ABC 3Pre-plant01800 248ABC 1Pre-plant0600 239ABC 7Pre-plant/Sensor0401555237ABC 9Pre-plant/Sensor01200 228BC 4Preplant/V4030 60225C 8Pre-plant/Sensor0800 223C 10Check0000186D Treatments with same letter are not statistically different at an 0.05 alpha
 Preplant N (lb/a) In-Season N (lb/a) Total N Applied (lb/a) Yield (bu/a) LSD Grouping 2Pre-plant A 6Preplant/V AB 5Preplant/V ABC 3Pre-plant ABC 1Pre-plant ABC 7Pre-plant/Sensor ABC 9Pre-plant/Sensor BC 4Preplant/V C 8Pre-plant/Sensor C 10Check D Treatments with same letter are not statistically different at an 0.05 alpha")
24
2014, Rossville Station

25
Excellent yields and significant response to N Clay lense at 24” to 36” depths held up water in the rooting zone, preventing leaching losses. As a result much higher yields were obtained compared to the 2013 Rossville site 186-257 bu/ac Sensor treatments were effective at finding 90% economic optimum, achieving 237 bu/ac from 55 lb of applied N/ac

26
2014, Scandia Station TreatmentTiming Method Starter N (lb/a) Preplant N (lb/a) In-Season N (lb/a) Total N Applied (lb/a) Yield (bu/a) LSD Grouping 6Preplant/V4090 180239A 3Pre-plant01800 232AB 9Pre-plant/Sensor012030150231AB 7Pre-plant/Sensor040120160229AB 2Pre-plant01200 223B 8Pre-plant/Sensor08060140223B 5Preplant/V4060 120218BC 1Pre-plant0600 204C 4Preplant/V4030 60189D 10Check0000163E Treatments with same letter are not statistically different at an 0.05 alpha
 Preplant N (lb/a) In-Season N (lb/a) Total N Applied (lb/a) Yield (bu/a) LSD Grouping 6Preplant/V A 3Pre-plant AB 9Pre-plant/Sensor AB 7Pre-plant/Sensor AB 2Pre-plant B 8Pre-plant/Sensor B 5Preplant/V BC 1Pre-plant C 4Preplant/V D 10Check E Treatments with same letter are not statistically different at an 0.05 alpha")
27
2014, Scandia Station

28
Excellent yields 163-239 bu/ac and significant response to applied N Low N loss Conducive conditions for mineralized N, resulting in high productivity, 163 bu/ac check Sensor treatments were effective at determining the optimum N rate (150 lb N/ac) and achieve high yield 231 bu/ac
 and achieve high yield 231 bu/ac")
29
Potential for Fertigation and Remote Sensing Would be able to conduct crop monitoring throughout the growing season, thus presenting the possibility to determine the optimize N rate and timing for any given soil and year (weather) Sensor algorithms must be specifically designed for fertigation systems Fertigation systems may need to apply N when water requirements have been met or exceeded
 Sensor algorithms must be specifically designed for fertigation systems Fertigation systems may need to apply N when water requirements have been met or exceeded")
30
2015 So Far

33
But… Heavy rain created anaerobic conditions Most fields did not need additional N

34
Questions

Similar presentations


 Drought tolerant vs. Non-drought tolerant -7.70.6 Monsanto vs. Pioneer 15.913.3.>")


 IN SOUTH DAKOTA ECONOMIC OPTIMUM NITROGEN RATE FOR HRSW IN SOUTH DAKOTA Nitrogen Use Efficiency Meeting Cheryl Reese*,>")


