Download presentation
Presentation is loading. Please wait.

1
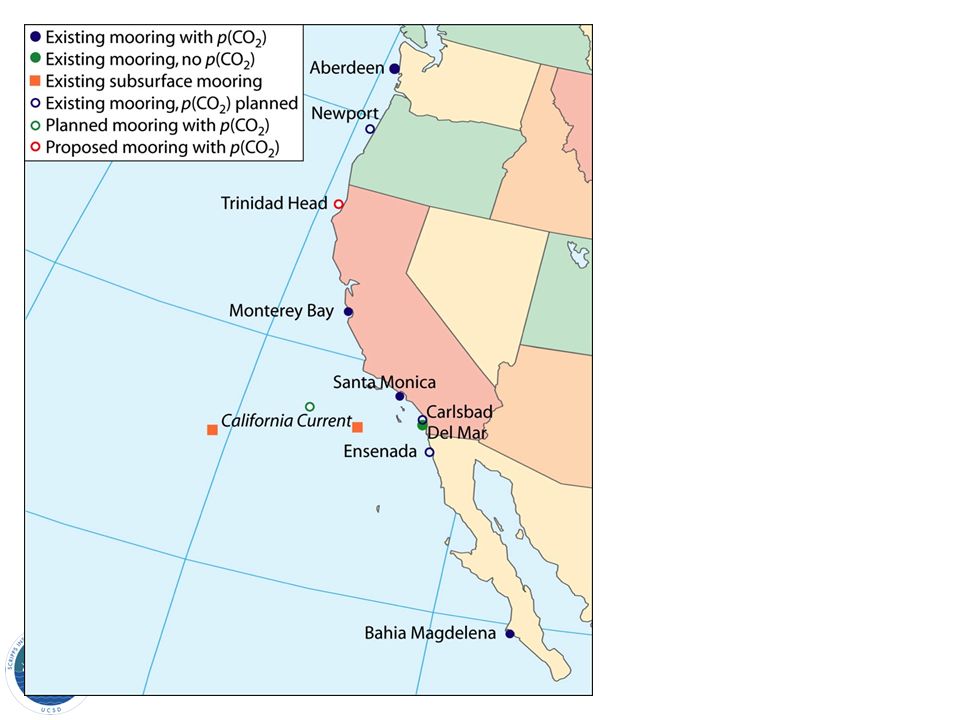
From Feely et al (2010) International Network
 International Network")
2
Diversity of Calcifiers

3
Ocean Acidification Becomes Warming’s ‘Evil Twin’ at COP15 Photos: Scripps Oceanography

4
CO 2 and pH “time series” data from North Pacific Ocean From R. Feely & D. Keeling

5
Since about 1850, the CO 2 chemistry of the oceans has been changing because of the uptake of anthropogenic CO 2 by the oceans. Decrease in pH of about 0.1 over the last two centuries; a projected decrease of 0.4 by 2100 Today’s ocean has undergone a 30% increase in acidity and a decrease in carbonate ion concentration of about 20% These changes in pH and carbonate chemistry may have profound impacts on many open ocean and coastal marine ecosystems. http://www.biol.tsukuba.ac.jp/~inouye Calcareous Plankton Ocean Acidification Coral Photo: Missouri Botanical Gardens

6
pH CO 3 2- CO 2(aq) Brewer (1997) CO 2 -induced seawater acidification: Simple chemistry Wolf-Gladrow, Riebesell, Burkhardt, Bijma (1999) Skirrow & Whitfield (1975)
 Brewer (1997) CO 2 -induced seawater acidification: Simple chemistry Wolf-Gladrow, Riebesell, Burkhardt, Bijma (1999) Skirrow & Whitfield (1975)")
7
Calcification/carbonate dissolution Saturation State phase Ca 2 CO 3 2 K sp,phase * 1 precipitation 1 equilibrium 1 dissolution Ca 2+ + CO 3 2- CaCO 3 Ca 2+ + CO 3 2- CaCO 3 Ω>1Ω>1 Ω<1Ω<1

8
A Path Forward We know enough to act: reduce CO2 To know precisely which commercial fisheries (& marine ecosystems) will be affected first… International measurement network: CO2 as function of time and depth, available for all –Corals –high latitudes, coastal, & open ocean Communal facilities for live organism studies Integrated Modeling “from CO2 to fish”
 will be affected first… International measurement network: CO2 as function of time and depth, available for all –Corals –high latitudes, coastal, & open ocean Communal facilities for live organism studies Integrated Modeling from CO2 to fish")
9
From Feely et al (2010) An International Network
 An International Network")
11
The groups already cooperate “Baja to BC” West Coast is one example which urgently needs ocean acidification observing system CO 2 observations will tell us where & when to look for biological effects Community experimental facility to test impacts on commercially & ecologically important species ‘Baja to BC” Test bed

12
In-Situ Measurements from Fixed Moorings Images: Uwe Send

13
Ocean CO2 data from today mooring.ucsd.edu

14
California Current Ecosystem (CCE) moorings Pt.Conception Gliders (CORC, LTER, Moore) CalCOFI/ LTER CCE-1 (SIO/ SWFSC/PMEL) The power of CCE1/2 comes from the context of other measurements - Ships sample many variables and provide ground truth - Gliders provide cross-shelf sampling with a few variables - Moorings give full time sampling, wide range of variables CalCOFI line 80 CCE-2 (SIO/ SWFSC/PMEL) Chlorophyll shown on surface; salinity on cross-section
 moorings Pt.Conception Gliders (CORC, LTER, Moore) CalCOFI/ LTER CCE-1 (SIO/ SWFSC/PMEL) The power of CCE1/2 comes from the context of other measurements - Ships sample many variables and provide ground truth - Gliders provide cross-shelf sampling with a few variables - Moorings give full time sampling, wide range of variables CalCOFI line 80 CCE-2 (SIO/ SWFSC/PMEL) Chlorophyll shown on surface; salinity on cross-section")
15

16
Question: Why do we think we can create a regional then global network? Answer: The oceanographic community has already built a network of 3000+ robots for temperature and salinity over last 12 years: Argo

17
Robot Positions 03 Dec 2010 26 nations contribute; data available to all www.argo.ucsd.edu

18
Davis and Roemmich with a float “robot” A profiling Argo float Argo Floats ROBOTS Depth Temperature Salinity Need to be Extended to Dissolved Gasses & biology

19
Ocean Temperature Increase: measured 0-700m NAtlSAtl NPac SPac NIndSind 19402000 Red=Observed Blue=Model average

20
A Lesson from Argo One proven route to an operational International network 1. Scientists do it first 2. Collect the data to “make the case” 3. Agencies and formal structures use that case to complete the network & make it “sustained” 4. “Light touch” open network structure survives the transition (much to the delight of scientists..)
.")
21

Similar presentations


>")


 - dissolves solids and gases readily (“universal solvent”) Last time (Wednesday)>")


