Download presentation
Presentation is loading. Please wait.

1
Evaluating City Governments’ Performance on Facilitating Business Innovation in China: Evidence from the Lien Chinese Cities Service-oriented Government Survey Presenter: Meng, Yu Public Policy and Global Affairs Program The School of Humanities and Social Sciences Nanyang Technology University, Singapore Shanghai, May 26, 2013

2
Outline Background and important concepts Research question Data Analytical results Tentative conclusions Limitations and future work

3
Background: Innovation and Its Role Knowledge-based economy: Innovation-driven Definition of innovation – New (Schumpeter 1934, 1943) – Combined with better performance or efficiency (Komninos 2008) How to achieve innovative capacities – Old notion: entrepreneurship of firms (Schumpeter 1934, 1943; Cantwell 1989; among many others) – New notion: innovation system (Jaffe 1986, 1989; Nelson and Winter 1982; Freeman 1987; Nelson and Rosenberg 1993) Innovation is affected by factors outside a business Spillovers from public R&D are important The size of population and the geographical agglomeration of universities and industries also matter
 – Combined with better performance or efficiency (Komninos 2008) How to achieve innovative capacities – Old notion: entrepreneurship of firms (Schumpeter 1934, 1943; Cantwell 1989; among many others) – New notion: innovation system (Jaffe 1986, 1989; Nelson and Winter 1982; Freeman 1987; Nelson and Rosenberg 1993) Innovation is affected by factors outside a business Spillovers from public R&D are important The size of population and the geographical agglomeration of universities and industries also matter")
4
Background: The Context of China The transition of public administration – Building service-oriented government Service-oriented government (Wu et al 2012) – Goal: serve the society consisting of citizens and social organizations – Function: providing effective public services and quality public goods The focus on cities – The importance of cities Major source of economic outcomes (>70% GDP; >80% tax revenue) Key locations for national innovative capacity building and S&T spillovers (>90% universities & research institutes) Models for PA transformation – Actual efforts on urbanization in China The rate of urbanization exceeded 50% in 2012
 – Goal: serve the society consisting of citizens and social organizations – Function: providing effective public services and quality public goods The focus on cities – The importance of cities Major source of economic outcomes (>70% GDP; >80% tax revenue) Key locations for national innovative capacity building and S&T spillovers (>90% universities & research institutes) Models for PA transformation – Actual efforts on urbanization in China The rate of urbanization exceeded 50% in 2012")
5
Research Question Put together the new trends – Innovation-driven global competition – The emerging service-oriented government in China – The critical position of cities in both the competition and the PA transformation to inquire: Do city governments provide quality services to facilitate local business innovation?

6
Data: Sources Panel data from Lien Survey – 30+ cities surveyed annually in 2010-12 – Around 700 and 100 valid responses from residents enterprises were collected respectively in each city – Business survey (~20 questions) Overall satisfaction Business environment Business participation in policymaking & implementation Government effectiveness Government official statistics City government annual reports China city statistical yearbooks National Statistics of the 2009 R&D Census
 Overall satisfaction Business environment Business participation in policymaking & implementation Government effectiveness Government official statistics City government annual reports China city statistical yearbooks National Statistics of the 2009 R&D Census")
7
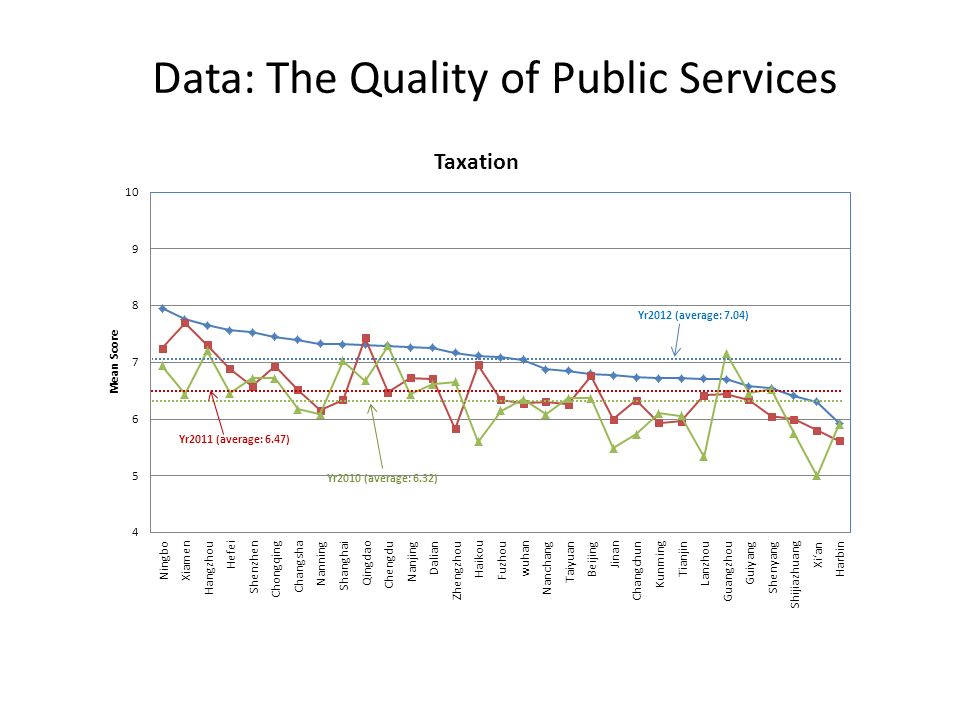
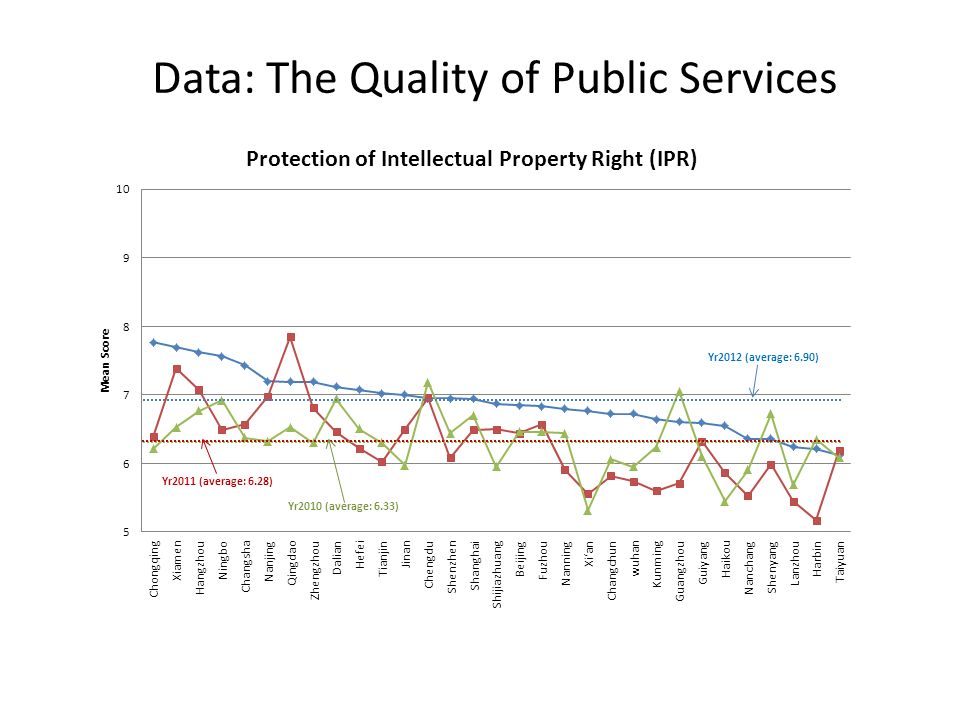
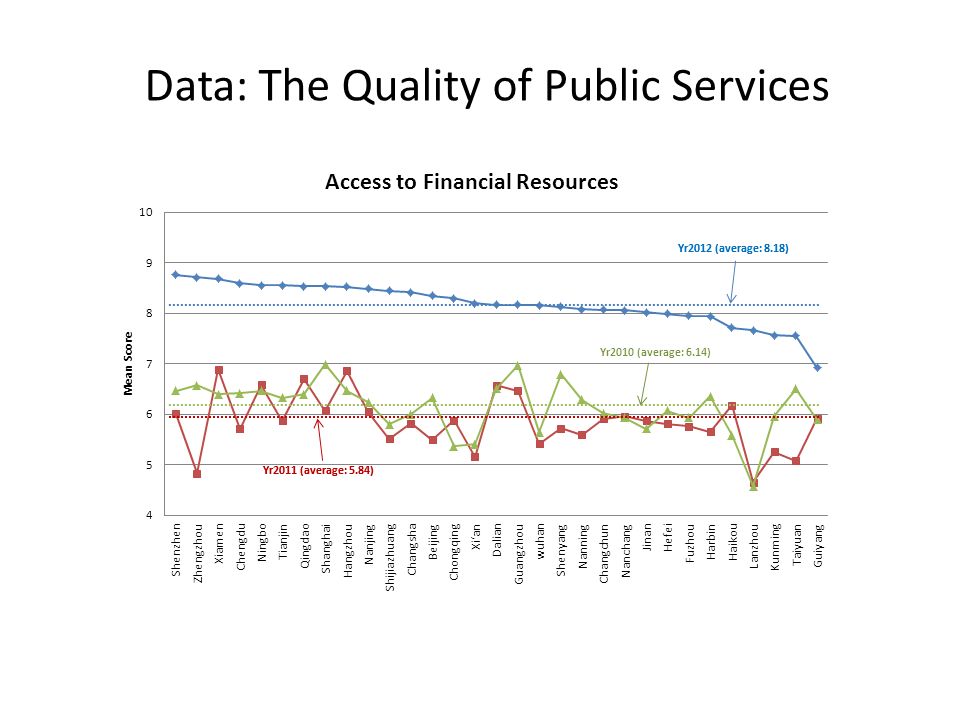
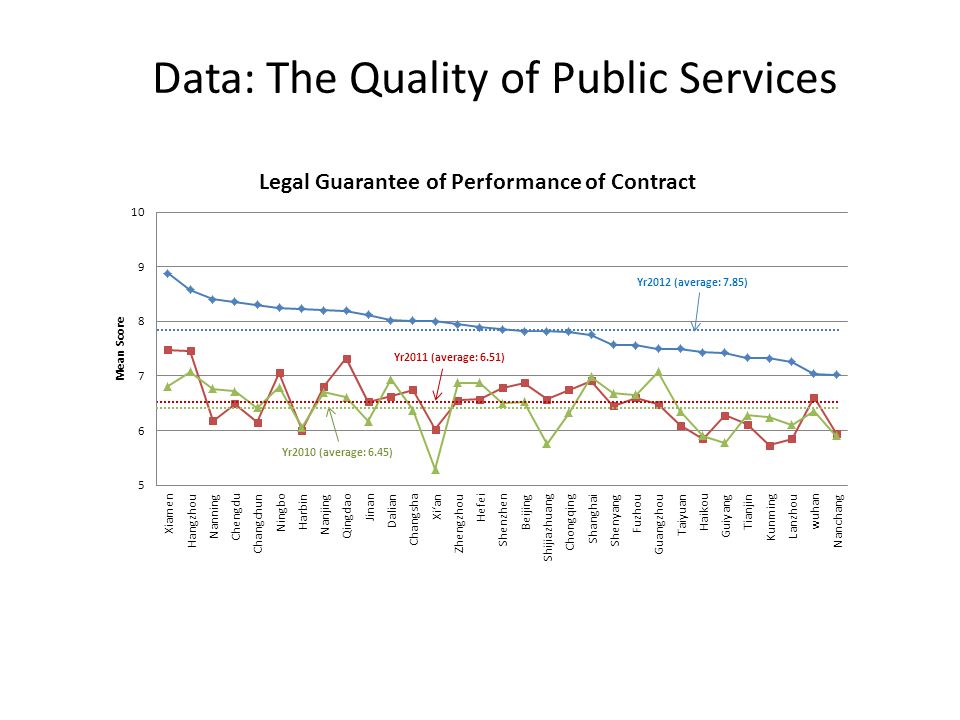
Data: Key Variables Innovation outcome – Technology contract turnover (its share in local GDP) The quality of public services that may promote innovative business environment and innovation outcomes (10-point scale) – Overall infrastructure – Taxation – Protection of intellectual property rights (IPR) – Access to financial resources – Legal guarantee of performance of contract The direct support from government on innovation (1 yr lag) – The R&D expenditure (its share in local GDP)
 The quality of public services that may promote innovative business environment and innovation outcomes (10-point scale) – Overall infrastructure – Taxation – Protection of intellectual property rights (IPR) – Access to financial resources – Legal guarantee of performance of contract The direct support from government on innovation (1 yr lag) – The R&D expenditure (its share in local GDP)")
8
Data: The Quality of Public Services

13
Data: Direct Support from Government

14
Data: Technology Contract Turnover (CNY100m) 201220112010 Beijing2458.51890.31579.5 ChangchunX21.0517.2 Changsha19.8515.3723.54 ChengduXX48.22 Chongqing223.5X147.53 Dalian131105.8X Fuzhou12.6514.38X GuangzhouX159.52136.8 GuiyangXXX HaikouXXX HangzhouX43.3741.73 Harbin64.257.650.93 Hefei42.333.4229.78 Jinan32.927.421.1 KunmingXXX LanzhouX16.86X Nanchang14.51210.1 Nanjing145.38120.2776.89 Nanning1.59XX Ningbo10.6410.99.82 Qingdao34.1720.7516.01 Shanghai588.52550.32525.45 ShenyangX8173.9 ShenzhenX111.27X Shijiazhuang10.79.67.6 Taiyuan12.310.097.65 Tianjin172.11113.99119.79 wuhan169.69107.5188.87 Xi‘an303.75204.5957.3 Xiamen59.2838.71X Zhengzhou65.15043
 Beijing ChangchunX Changsha ChengduXX48.22 Chongqing223.5X Dalian X Fuzhou X GuangzhouX GuiyangXXX HaikouXXX HangzhouX Harbin Hefei Jinan KunmingXXX LanzhouX16.86X Nanchang Nanjing Nanning1.59XX Ningbo Qingdao Shanghai ShenyangX ShenzhenX111.27X Shijiazhuang Taiyuan Tianjin wuhan Xi‘an Xiamen X Zhengzhou")
15
Data: Innovation Outcome

16
Analysis: Correlations 1234567 1. The share of technology contract turnover in GDP1.000 2. Overall infrastructure0.1481.000 3. Taxation-0.0250.7831.000 4. Protection of IPR0.0080.8150.7911.000 5. Access to financial resources0.0530.7920.6520.6801.000 6. Legal gurantee of performance of contract0.0800.8470.7430.7790.8761.000 7.The share of R&D expenditure in GDP0.7250.036-0.160-0.151-0.075-0.0791.000

17
Analysis: Multivariate Regressions Model 1Model 2 Overall infrastructure 1.95*0.11 (0.90)(0.68) Taxation -1.23-0.25 (0.92)(0.67) Protection of IPR -0.940.2 (1.03)(0.75) Access to financial resources -0.45-0.14 (0.58)(0.41) Legal guarantee of performance of contract 0.460.57 (1.03)(0.74) The share of R&D expenditure in GDP 1.55*** (0.20) Constant 2.98-5.58 (3.89)(2.98) Obs. 68 R2R2 0.0940.547 OLS Regression on the share of technology contract turnover in local GDP

18
Tentative Conclusions Direct R&D expenditure is strongly and positively associated with technology contract turnover Business environment relevant public services provided by local governments seem to have weak relationship with innovation outcomes.

19
Limitations and Future Work Limitations – Small sample – Only quantitative data – Simple model Directions for future work – Refine the questionnaire – Collect qualitative data Search of meaning Specifications for model-building

20
Thank You!

Similar presentations


 New York, February,>")


