Download presentation
Presentation is loading. Please wait.

1
Quick and Simple Statistics Peter Kasper

2
Basic Concepts Variables & Distributions Variables & Distributions Mean & Standard Deviation Mean & Standard Deviation Estimators & Errors Estimators & Errors Comparing Two Sample Results Comparing Two Sample Results Significance Significance t-Tests t-Tests

3
Variables & Distributions A Variable is anything that can be.. A Variable is anything that can be.. –Measured (continuous variable) E.g. The height of vegetation in an area E.g. The height of vegetation in an area –Counted (discreet variable) E.g. The number of birds in an area E.g. The number of birds in an area –Categorized (categorical variable) E.g. Birds that are grassland specialists or not grassland specialists E.g. Birds that are grassland specialists or not grassland specialists
 E.g. The height of vegetation in an area E.g. The height of vegetation in an area –Counted (discreet variable) E.g. The number of birds in an area E.g. The number of birds in an area –Categorized (categorical variable) E.g. Birds that are grassland specialists or not grassland specialists E.g. Birds that are grassland specialists or not grassland specialists.")
4
Variables & Distributions Each variable has a “natural” distribution i.e. the frequency at which particular values of the variable occur Each variable has a “natural” distribution i.e. the frequency at which particular values of the variable occur A common example is the “Bell Curve” A common example is the “Bell Curve” –In general can be arbitrary!

5
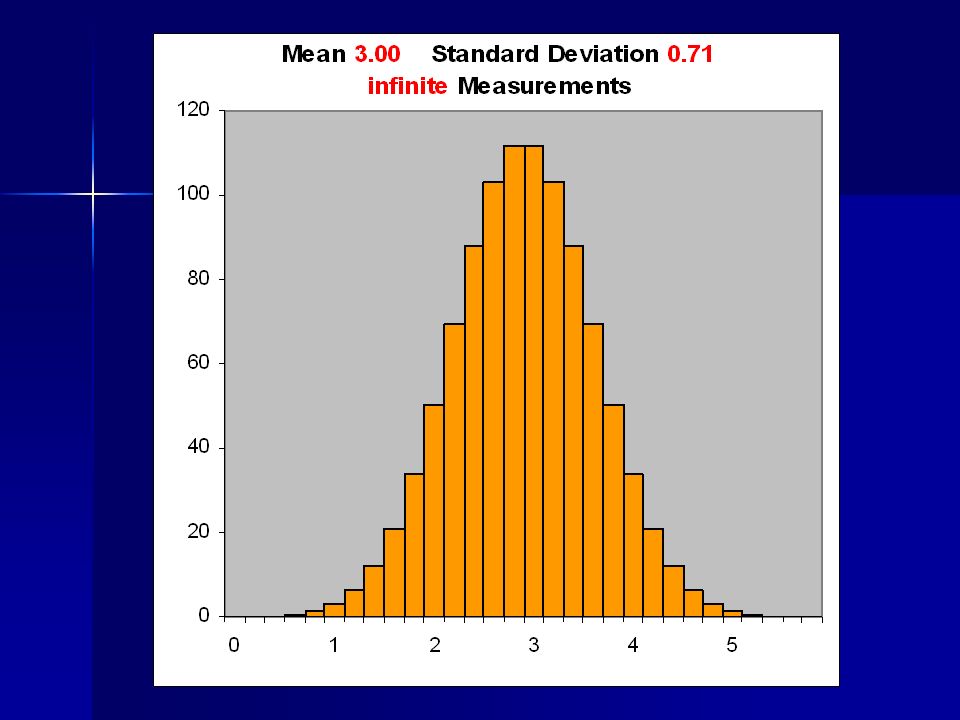
A “Bell Curve” distribution Another “Bell Curve” distribution Different “average” value and different width

6
Mean & Standard Deviation The mean of a sample of n measurements of some variable is defined as.. The mean of a sample of n measurements of some variable is defined as.. μ= ∑ i v i / n The “standard deviation” or width of the distribution is.. The “standard deviation” or width of the distribution is.. σ 2 = ∑ i (v i - μ ) 2 / ( n – 1 )
 2 / ( n – 1 ).")
7
For a Bell Curve distribution 68% of values are within 1 of the mean 95% of values are within 2 of the mean

9
Estimators & Errors The values for μ and σ from finite samples vary even if the samples are part of the same distribution The values for μ and σ from finite samples vary even if the samples are part of the same distribution They are Estimators of the “true” values. They are Estimators of the “true” values. The “error” on the estimators indicates how much variation is expected The “error” on the estimators indicates how much variation is expected

10
Estimators & Errors The Standard Error on the mean of a sample of n measurements is defined as.. The Standard Error on the mean of a sample of n measurements is defined as.. SE μ = σ / √n The error gets smaller as the sample size increases The error gets smaller as the sample size increases μ has a “Bell Curve” distribution with mean = “true mean” and SD = SE μ μ has a “Bell Curve” distribution with mean = “true mean” and SD = SE μ

11
Comparing Results Assume two different samples … Assume two different samples … –Are they from the same distribution? –Compare the two means –The difference in the means will usually not be zero –How do we measure the significance of an observed difference It will clearly depend on the standard errors It will clearly depend on the standard errors

12
Comparing Results The standard error on the difference between to quantities is defined as.. The standard error on the difference between to quantities is defined as.. SE diff = √( SE 1 2 + SE 2 2 ) If the two results are from the same distribution (“Null Hypothesis”) If the two results are from the same distribution (“Null Hypothesis”) –The difference will be a “Bell Curve” distribution with mean = zero and Standard Deviation = SE diff
 If the two results are from the same distribution ( Null Hypothesis ) If the two results are from the same distribution ( Null Hypothesis ) –The difference will be a Bell Curve distribution with mean = zero and Standard Deviation = SE diff.")
13
Significance Can use the difference of the means, Δ, and its error to measure the likelihood of an observed difference. Can use the difference of the means, Δ, and its error to measure the likelihood of an observed difference. What is the probability of randomly getting a bigger difference than we obtained? What is the probability of randomly getting a bigger difference than we obtained? –Assuming a “Bell Curve” … –Probability = 32% if |Δ| = SE Δ –Probability = 5% if |Δ| = 2 x SE Δ

14
Significance This is NOT the same thing as the “probability that the two distributions are the same”. This is NOT the same thing as the “probability that the two distributions are the same”. –Probability = 1 if Δ = 0 ! –But it is clearly not impossible to measure the same mean from two similar but different distributions

15
t-Tests When the size of a sample is small (<30 measurements), we need to take into account the uncertainty in the estimates of the Standard Errors When the size of a sample is small (<30 measurements), we need to take into account the uncertainty in the estimates of the Standard Errors Instead of comparing Δ/SE Δ with a “Normal” Bell curve distribution, Compare a variable t with a tabulated t-distribution. Instead of comparing Δ/SE Δ with a “Normal” Bell curve distribution, Compare a variable t with a tabulated t-distribution.

16
t-Tests The t variable is defined as The t variable is defined as t = Δ / √( s 2 /n 1 + s 2 /n 2 ) where s 2 = { (n 1 -1)SE 1 2 + (n 2 -1) SE 1 2 } / (n 1 +n 2 -2) The number of degrees of freedom (needed by the tables) are (n 1 -1) and (n 2 -1) The number of degrees of freedom (needed by the tables) are (n 1 -1) and (n 2 -1)
 where s 2 = { (n 1 -1)SE (n 2 -1) SE 1 2 } / (n 1 +n 2 -2) The number of degrees of freedom (needed by the tables) are (n 1 -1) and (n 2 -1) The number of degrees of freedom (needed by the tables) are (n 1 -1) and (n 2 -1)")
17
Conclusion This talk has skipped a LOT of details This talk has skipped a LOT of details It was designed to give you a feel for concepts It was designed to give you a feel for concepts There are lots of resources on the web and in the library There are lots of resources on the web and in the library

Similar presentations


 “Dependent-means.>")


. After treatment, the.>")


, μ unknown, σ known.>")

. After treatment,>")
