Download presentation
Presentation is loading. Please wait.

1
Data Project Levels G & H

2
L EARNING O BJECTIVE : Throughout the project you will be learning to use key words that are involved with data. You will be collecting, displaying and interpreting data correctly. SUCCESS CRITERIA You will be successful if you can: Use all key terms correctly Collect accurate data from the selection provided Display this data using the correct graphical method Write statements identifying key finding from your data

3
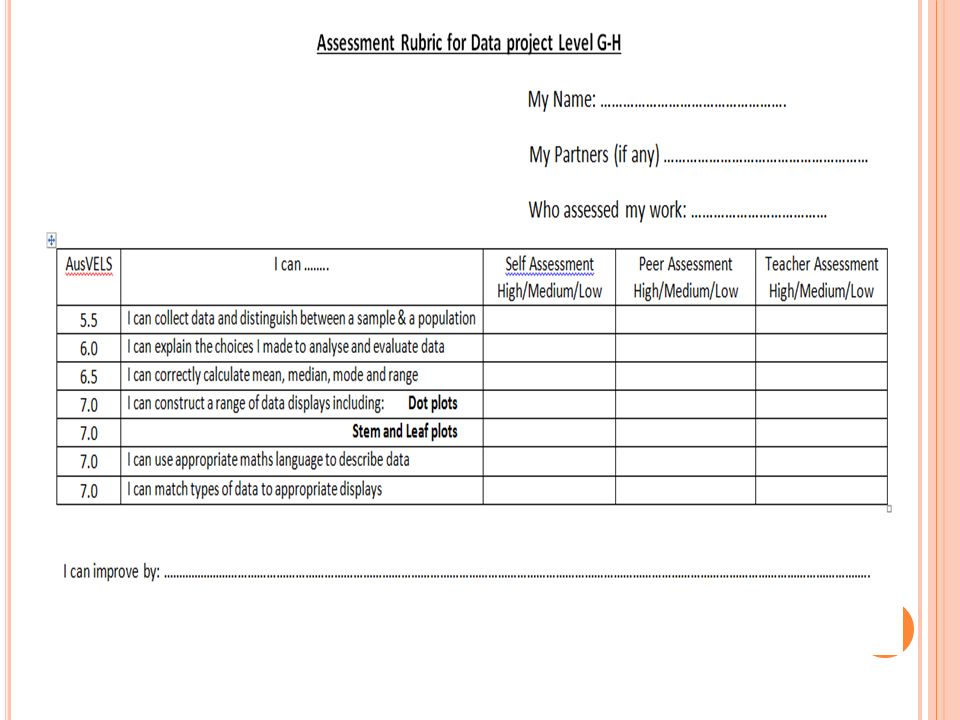
P RESENTATION OF YOUR WORK You can work alone, with a partner, or in a group of 3 but each person needs to prepare and post their own record of the work completed. You can choose how to present your work but it must be clear that you 1. understand the key words, 2. can calculate the required values and 3. can choose appropriate displays for different sets of data. Assessment You will be assessed by the rubric provided. You will complete a self assessment, peer assessment and your teacher will also assess you final report as well as your work during each lesson.

4
P HASE 1 - G LOSSARY OF M ATHS L ANGUAGE Use the online Maths Dictionary for Kids to compile a glossary which shows the meaning of the key words described in italics below. Include an example where it helps to show the meaning. Numerical (quantitative) data and the difference between discrete data and continuous data. Non-numerical (qualitative) data and the difference between categorical data and ordinal data. Frequency table, dot plot, histogram, column graph, stem and leaf plot, pie graph, population, sample range, median, mode, mean,
 data and the difference between discrete data and continuous data. Non-numerical (qualitative) data and the difference between categorical data and ordinal data. Frequency table, dot plot, histogram, column graph, stem and leaf plot, pie graph, population, sample range, median, mode, mean,.")
5
P HASE 2 – C ALCULATIONS USING D ATA CARDS Select suitable data display it in a frequency table and calculate the mean, mode median and range. Mean, median and mode all indicate the “centre” of the data spread. Explain which one you think gives the best indication of the centre.

6
P HASE 3 – G RAPHING THE D ATA With all of your graphs remember to include a title and to label the axes. Write a short paragraph to explain why each graph is suitable for that particular type of data, using the key words from your glossary. Choose one set of continuous data and one set of discrete data from the information printed on the cards. Graph the data appropriately by using a histogram for the continuous data and a dot plot for discrete data. HINT: You will have to decide on the intervals to use for the histogram. Revisit “The Maths Dictionary for kids” if you have forgotten what a histogram looks like.

7
P HASE 3 – G RAPHING THE D ATA ( CONTINUED ) Use T shirt design as an example of categorical data. Decide how many categories you will use. Is there a mode? Choose a suitable technique to graph this data, one that you have not already used in this project. GRAPHING OUR OWN DATA Using the combined maths class as a population, choose a sample group and measure their heights. Display the information as a Stem & Leaf plot. Things to consider: How many students will be in your sample? Will you choose them randomly? Will you include boys and girls? Explain why you made the choices you did.

8
P HASE 4 – C OMPLETION AND A SSESSMENT Complete all unfinished tasks and post them to your Blog. Write a conclusion that summarises how well you think you achieved the learning objectives: e.g What terms are the easiest/hardest to remember? How do graphs help in interpreting data? Which graph do you like best? Why? Assess yourself and at least one other person not from your group against the assessment rubric. Have someone not from your group assess you.

9
T IMELINE FOR COMPLETION W EEK 1 Phase 1 - Glossary completed on Blog by the end of lesson 2. Phase 2 – Data chosen and collected into a frequency table. Mean, median, mode and range calculated. All calculations and explanation on Blog by end of lesson 3. WEEK 2 Phase 3 - Graphing the data. Histogram and dot plot completed by the end of lesson 2. On Blog. Phase 3 continued- T shirt data commenced.

10
W EEK 3 Phase 3 - Graphing the data continued. T shirt display completed and on Blog by end of lesson 1. Class sample of heights graphed, choices explained and posted by the end of lesson 3. WEEK 4 Phase 4 – Completion and Assessment. Revisit slide show to make sure all tasks are completed and on your Blog. Write a summary of your learning and carry out self and peer assessment. Hand your assessment rubric to your teacher.

Similar presentations
 C2-4: Categorical and Quantitative Data.>")


 data we often use a.>")


