Download presentation
Presentation is loading. Please wait.

1
David Medvigy (Duke University) Amazon in Perspective: Integrated Science for a Sustainable Future Manaus, Brazil 20 November 2008 Hydroclimatic consequences of land cover change in the Amazon
 Amazon in Perspective: Integrated Science for a Sustainable Future Manaus, Brazil 20 November 2008 Hydroclimatic consequences of land cover change in the Amazon")
2
Deforestation and the Amazon --- Six major watersheds will lose at least 2/3 of their forest cover

3
The Scaling Challenge 1) In global simulations, the size of a grid cell (2-5 degrees) is much larger than the typical scale of deforestation (10s of km or smaller). Furthermore, the size of a grid cell is too large to represent important mesoscale effects. 2) Mesoscale simulations solve these resolution-related problems. However, they rely on boundary conditions from a global model. months years decades 10s of km 4 degree continental global deforestation Most studies (GCMs) Mesoscale models 3) One solution: The problems of resolution and boundary conditions can simultaneously be addressed using a variable-resolution global model. OLAM 4) Ultimate objective: simulate the full, time-dependent mesoscale and global responses to deforestation.
 Mesoscale simulations solve these resolution-related problems. However, they rely on boundary conditions from a global model. months years decades 10s of km 4 degree continental global deforestation Most studies (GCMs) Mesoscale models 3) One solution: The problems of resolution and boundary conditions can simultaneously be addressed using a variable-resolution global model. OLAM 4) Ultimate objective: simulate the full, time-dependent mesoscale and global responses to deforestation..")
4
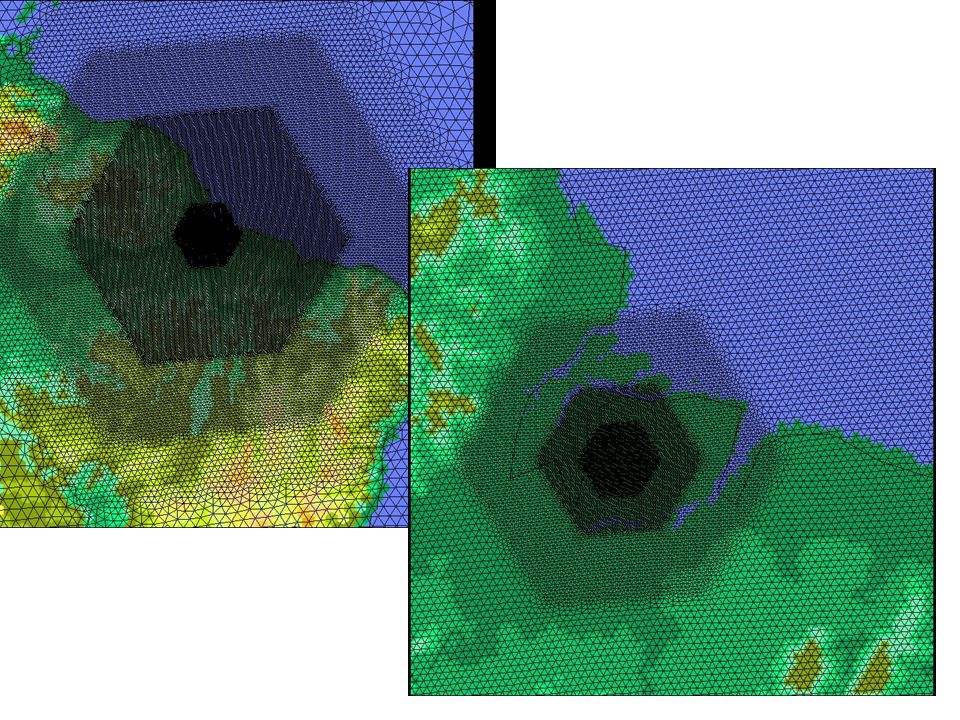
The Ocean-Land-Atmosphere Model (OLAM): An expansion of RAMS into an Earth System Model OLAM solves a finite-volume analog of the full compressible Navier- Stokes equations in conservation form, and exactly conserves mass and momentum. Icosahedron Unstructured Grid; No overlapping grid cell; No special nest communication; Each cell communicates directly with its neighbor independently of resolution Staggered C Grid; Shaved, Cartesian coordinates

6
Simulation Strategy 1.Carried out 2 simulations from October 1996 through December 2000 2.Both used 50 km resolution over South America, expanding to 400 km for the rest of the world. 3.One simulation used current land cover. The other used the projected land cover for 2050 from the Soares-Filho et al. (2006) business-as-usual (BAU) scenario. Crop/mixed farming Evergreen broadleaf forest Wooded grassland Deciduous shrub Short grass Desert, bare soil Other land cover Water CURRENT LAND COVER BAU 2050 PROJECTED LAND COVER
 business-as-usual (BAU) scenario. Crop/mixed farming Evergreen broadleaf forest Wooded grassland Deciduous shrub Short grass Desert, bare soil Other land cover Water CURRENT LAND COVER BAU 2050 PROJECTED LAND COVER.")
7
Simulation Average Precipitation [mm month -1 ] Current LC 154 BAU 2050 LC 156 Impact of deforestation on regional (15S – 5N; 75W – 50W) precipitation
![Simulation Average Precipitation [mm month -1 ] Current LC 154 BAU 2050 LC 156 Impact of deforestation on regional (15S – 5N; 75W – 50W) precipitation](http://images.slideplayer.com/26/8375312/slides/slide_7.jpg "Simulation Average Precipitation [mm month -1 ] Current LC 154 BAU 2050 LC 156 Impact of deforestation on regional (15S – 5N; 75W – 50W) precipitation")
8
Difference in average precipitation [mm y -1 ] 2050 land cover minus current land cover Impact of deforestation on precipitation 1.Increase in northeast part of basin 2.Increase along eastern slopes of Andes 3.Decrease in central Amazon CURRENT > BAU CURRENT < BAU
![Difference in average precipitation [mm y -1 ] 2050 land cover minus current land cover Impact of deforestation on precipitation 1.Increase in northeast part of basin 2.Increase along eastern slopes of Andes 3.Decrease in central Amazon CURRENT > BAU CURRENT < BAU](http://images.slideplayer.com/26/8375312/slides/slide_8.jpg "Difference in average precipitation [mm y -1 ] 2050 land cover minus current land cover Impact of deforestation on precipitation 1.Increase in northeast part of basin 2.Increase along eastern slopes of Andes 3.Decrease in central Amazon CURRENT > BAU CURRENT < BAU")
9
Why is OLAM break from the standard paradigm? 2.The representation of topography is critical. Deforestation reduces simulated latent+sensible heat fluxes, but this has the effect of enhancing the importance of orographic forcing for lifting air parcels. 1.While deforested areas indeed have reduced latent heat flux, this is partially compensated for by increased latent heat flux in non-deforested areas. Because most GCM studies have assumed 100% deforestation, they miss this affect. Latent Heat [W m -2 ], 2050 – current land cover Not deforested 3.In fact, when OLAM was run with a “total deforestation” scenario and coarse topography, the deforested case had 12% less precipitation. This is comparable to results obtained with the RAMS regional model.

10
Conclusions and next steps 1.OLAM simulates only a small impact of deforestation on Amazon hydroclimate. This contrasts with the results from other GCMs. 2.While most of the basin experiences decreased evapotranspiration, some (non- deforested) areas experience increased evapotranspiration. There is an overall increase in moisture convergence due to changes in roughness and land-sea pressure gradient. 3. A regional re-distribution of precipitation was simulated. Precipitation decreases in the central basin, but increases in non-deforested areas and near topography. 4. Previous, coarser-resolution studies differ (in part) because of assumptions of total deforestation and coarser representation of topography. Current work: -- In reality, the transition between “current” and deforested vegetation is gradual, playing out over decades. -- Furthermore, there are likely to be feedbacks between intact forest, the atmosphere, and deforested regions. -- Therefore, we are carrying out 50-100 yr simulations with OLAM coupled to the ED2 dynamic vegetation model.
 areas experience increased evapotranspiration. There is an overall increase in moisture convergence due to changes in roughness and land-sea pressure gradient. 3. A regional re-distribution of precipitation was simulated. Precipitation decreases in the central basin, but increases in non-deforested areas and near topography. 4. Previous, coarser-resolution studies differ (in part) because of assumptions of total deforestation and coarser representation of topography. Current work: -- In reality, the transition between current and deforested vegetation is gradual, playing out over decades. -- Furthermore, there are likely to be feedbacks between intact forest, the atmosphere, and deforested regions. -- Therefore, we are carrying out yr simulations with OLAM coupled to the ED2 dynamic vegetation model..")
Similar presentations


, Yamina Silva (Peru), Daniel Martinez (Cuba) ICTP Workshop on the.>")

 Vani Starry Manoharan University of Alabama in Huntsville Environmental Stability of Forest Corridors in the Mesoamerican Biological.>")
 By: J. Shukla et. all Combined Climate and Carbon-Cycle.>")


