Download presentation
Presentation is loading. Please wait.

1
Spatially Assessing Model Error Using Geographically Weighted Regression Shawn Laffan Geography Dept ANU

2
Non-spatial methods are increasingly used to model and map continuous spatial properties –Artificial Neural Networks, Decision Trees, Expert Systems... –These can use more ancillary variables than explicitly spatial methods Usually assessed using non-spatial global error measures –Summarise many data points –Cannot easily identify where model is correct

3
Error residuals may be mapped –But usually points –Difficult to visually identify spatial clustering –Large point symbols no multi-scale no quantification Can use spatial error analysis to detect clusters of similar prediction –Use these areas with confidence –Areas with unacceptable error indicate need for different variables or approach

4
To spatially assess model error a method should: –Locally calculate omission, commission & total error in original data units in one assessment one dataset each –Assess error for unsampled locations generate spatially continuous surfaces for easier interpretation –Provide confidence information about the assessment uncertainty estimate

5
Possible approaches: –Mean, StdDev, Range for spatial window three attributes to interpret for each of omission, commission and total error mean will often not equal zero –Co-variograms global assessment work only for sampled locations –Local Spatial Autocorrelation –Geographically Weighted Regression

6
Local Spatial Autocorrelation: –indices of spatial association –easy to interpret –multi-scale –calculate residuals and assess spatial clustering –some indices calculable for unsampled locations Getis-Ord G i *, Openshaw’s GAM

7
Local Spatial Autocorrelation: –Give difference from expected (global mean) mean will not normally be zero –Must analyse omission & commission separately partly cancel out leads to numeric and sample density problems – confidence information
 mean will not normally be zero –Must analyse omission & commission separately partly cancel out leads to numeric and sample density problems – confidence information")
8
Geographically Weighted Regression –multivariate spatial analysis in the presence of non-stationarity –perform regression within a moving spatial window –multi-scaled –can directly assess residual error without prior calculation –simultaneous omission, commission and total error assessment –estimates for unsampled locations –r 2 parameter gives confidence information

9
The approach: –Ordinary Least Squares Y = a + bX –calculated for circles of increasing radius across the entire dataset minimum 5 sample points –no spatial weight decay with distance does not force an assumed distribution on the data –optimal spatial scale when r 2 is maximum

10
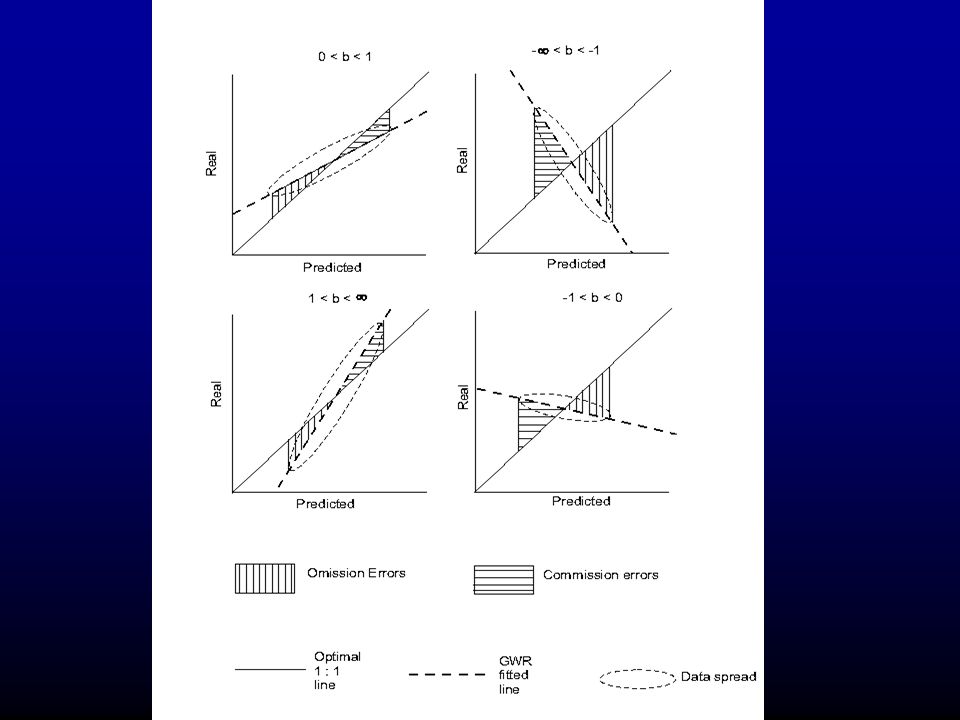
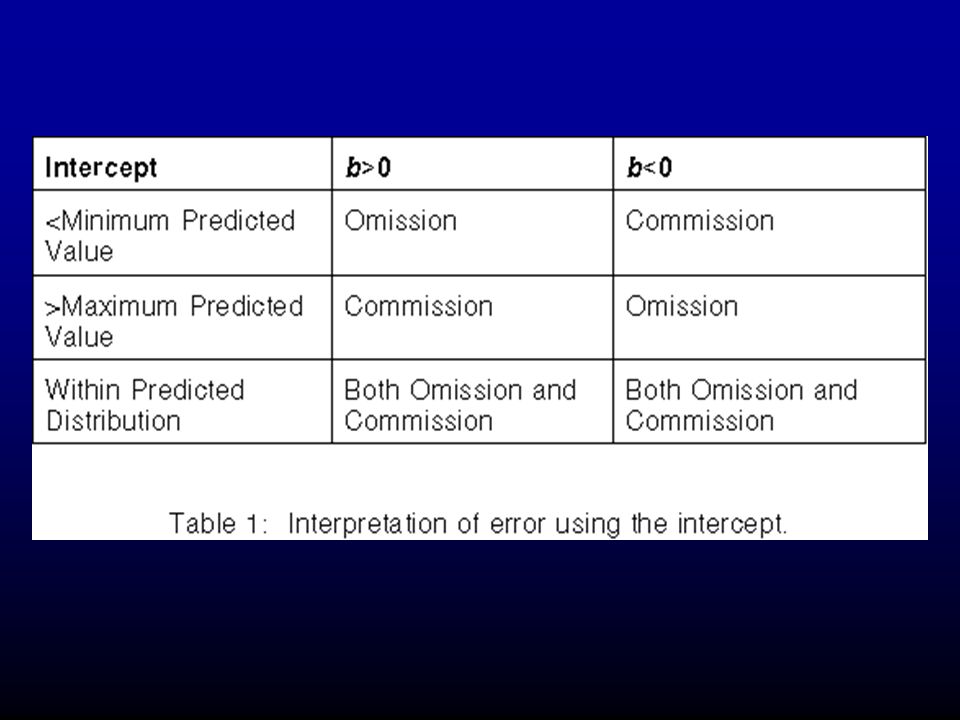
Interpreting regression parameters for error: –error is the square root of the area between the fitted and the optimal lines –this is bounded by the min and max of the predicted distribution as b approaches 1 the intercept approaches +/- infinity causing extremely large error values –use the intersection of the fitted line with the optimal line (1:1, Y=X) to determine omission & commission
 to determine omission & commission")
13
The r 2 parameter –high r 2 means reliable b parameters and therefore reliable error measures –low values indicate low confidence caused by dispersed data values these areas cannot be used as b is meaningless

14
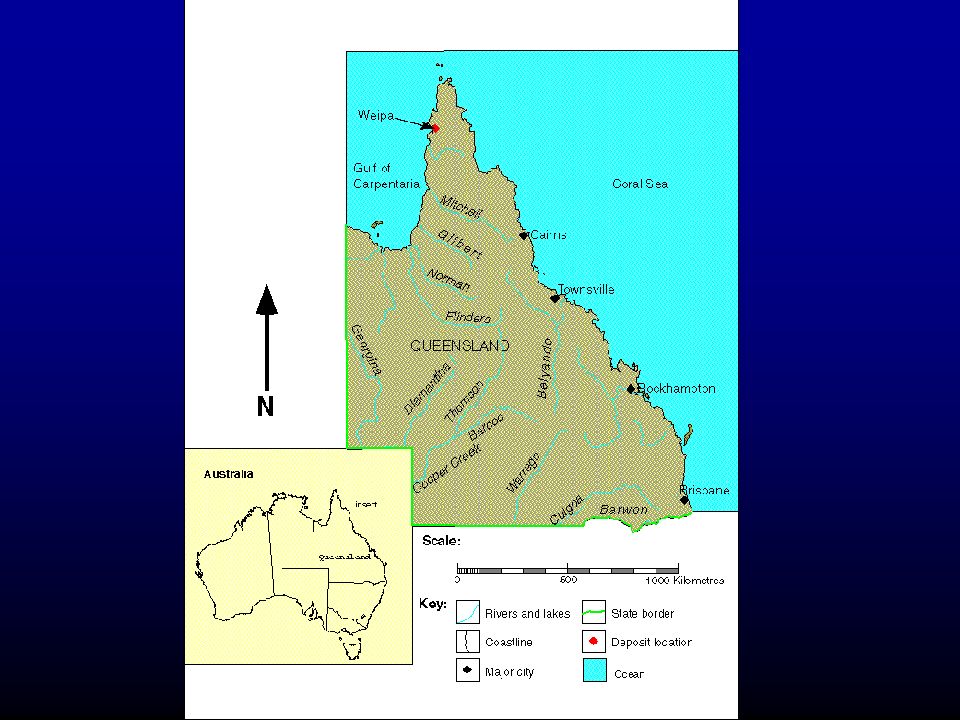
Example application –feed-forward ANN to infer aluminium oxide –used topographic and vegetation indices –1100 km 2 area at Weipa, Far North Queensland, Australia –16000 drill cores –30.4% accurate within +/- 1 original unit –48.7% accurate within +/- 2 original units

16
Subset of study area

17
Total error : 4, 7 & 10 cell radius

18
Total OmissionCommission

19
Optimal spatial lag Max r 2

20
r 2 = red omission = green commission = blue Visualising error distribution with confidence information

22
Limitations –sample density & distribution –outliers data & spatial cause low r 2 landscape does not operate in circles

23
Extended Utility –can use the regression parameters to correct the ANN prediction –similar to universal kriging but ANN allows for the inclusion of more ancillary variables –have not taken into account r 2 values

24
Comparison with universal kriging

25
Conclusions: –GWR allows the spatial investigation of non-spatial model error –calculates total, omission and commission error in one assessment, with confidence information –identified locations of good and poor model prediction in a densely sampled dataset not immediately obvious without GWR –currently exploratory significance tests would be useful

Similar presentations


 Coordinator California Department of Fish and Game.>")

>")


