Download presentation
Presentation is loading. Please wait.

1
Function Tables CCSS6.EE.9: Represent and analyze quantitative relationships between dependent and independent variables. Please copy your Agenda for the week. You will get your quiz back and we will go over it. Materials needed today: Journal, pencil, glue, ruler, highlighter, scissors, Easter candy for your teacher!

2
VOCABULARY A function is a relation that assigns exactly one output value to one input value. The output depends on the input. The function rule describes the relationship between each input and output. You can organize the input-output values and the function rule in a function table. In a function, the input value is also known as the independent variable, since it can be any number you choose. The value of the output depends upon the input value, so the output value is known as the dependent variable.

3
InputOutput 1 6 2 7 3 8 4 9 Instructions: Look at the input value and determine what rule applies to get the output value.

4
Rule : add 5, n+5

5
InputOutput 1 3 2 6 3 9 4 12

6
RULE: multiply by 3, 3n or 3 n Good job. Keep going.

7
InputOutput 1 10 2 20 3 30 4 40

8
Rule: multiply by 10, 10 n or 10n

9
InputOutput 4 2 7 5 10 8 30 28

10
Rule: subtract 2 or n - 2

11
InputOutput 16 8 24 16 28 20 60 52

12
Rule: Subtract 8, or n - 8

13
InputOutput 5 50 8 80 20 200 100 1,000

14
Rule: multiply by 10; 10 n, or 10n

15
Try more examples on this website: http://www.studyzone.org/testprep/math4/d/f unctiontable4l.cfm

16
Input Independent variable x-axis Domain Output Dependent variable y-axis Range

18
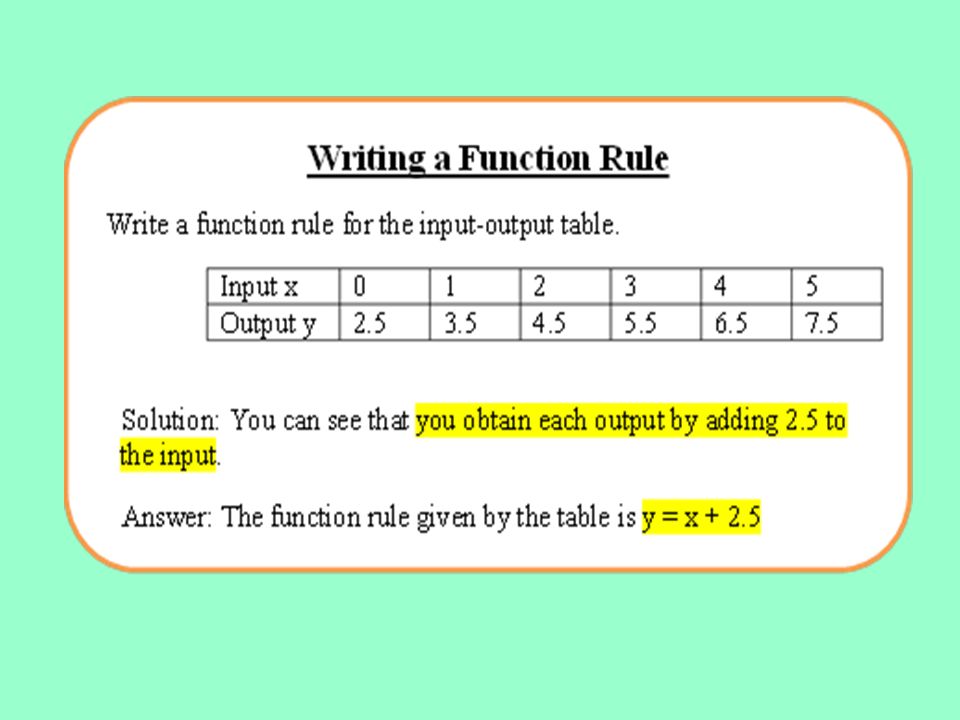
Solution: You can see that you obtain each output by adding 5 to the input. Answer: The function rule given by the table is b = a + 5

19
How can a function table help you find the input or the output? When data is organized, we can use the function rule and the input to find the output or work backward using the output and the function rule to find the input.

20
Are they functions? A.) B.) input x 1357 Output y 0246 Input a 2462 Output b 1851 B.) IS NOT A FUNCTION! Why not?
 B.) input x 1357 Output y 0246 Input a 2462 Output b 1851 B.) IS NOT A FUNCTION. Why not .")
21
VOCABULARY The set of all input values is called the domain of a function. The set of all output values is called the range of a function.

22
Application Problem Write a function rule that converts y years to m months. Use the function to calculate the number of months in 12 years. Create a function table. Then state the domain and the range of the function. (You can create your own function table. Use your ruler for the table and the graph.)
.")
23
The End. Great Job! Resource: Virginia Mathematics, Scott Foresman – Addison Wesley

Similar presentations


>")


 a + 4 = 9 2) b - 4 = 9 3)>")

_____6) ______ {(-20, -38); (-10, -18); (0, 2); (10, 2)} 7)_____ Name:________________________________________________________________________________Date:_____/_____/__________.>")


