Download presentation
Presentation is loading. Please wait.

1
Estimates and Averages October 5, 2015 (2.2 in your books)
")
2
Meme Moment

3
Accuracy vs Precision Accurate: close to the real answer Precise: close together Scientists want to be accurate AND precise !

4
Estimates When we’re working with really big numbers, we often estimate instead of counting to save time Scientists do this too! Especially with measurements. o When we use a beaker, graduated cylinder, etc, we estimate between the smallest marks to get a more accurate number. 50 mL 100 mL 150 mL 200 mL 125 mL estimate – even though there’s no mark here!

5
Averages When we have lots of estimates (or measurements ), we often want to find the average. The average is usually closest to the accurate (real) number. 3 Types of Averages Mean Median Mode
 number. 3 Types of Averages Mean Median Mode.")
6
Mean Most common type of average Mean: the numerical average of a set of data Math: add up all the numbers, then divide by how many Computer shortcut: =average(B1:B4)
")
7
Median Often used in geography, etc. “Median income,” “median home price” Median: the middle number in an ordered set of data Math: Put the numbers in order, then find the one in the middle. If you have an even number, find the two middle numbers and divide by 2. Computer shortcut: =median(B1:B10)
.")
8
Median Math: Put the numbers in order, then find the one in the middle. If you have an even number, find the two middle numbers and divide by 2.

9
Mode In French, “mode” means fashion! If it’s fashionable, lots of people have it Mode: the number that appears most often in a set. You can have more than 1 answer for mode. Math: have to look with your eyes Computer shortcut: =mode(B1:B10)
.")
10
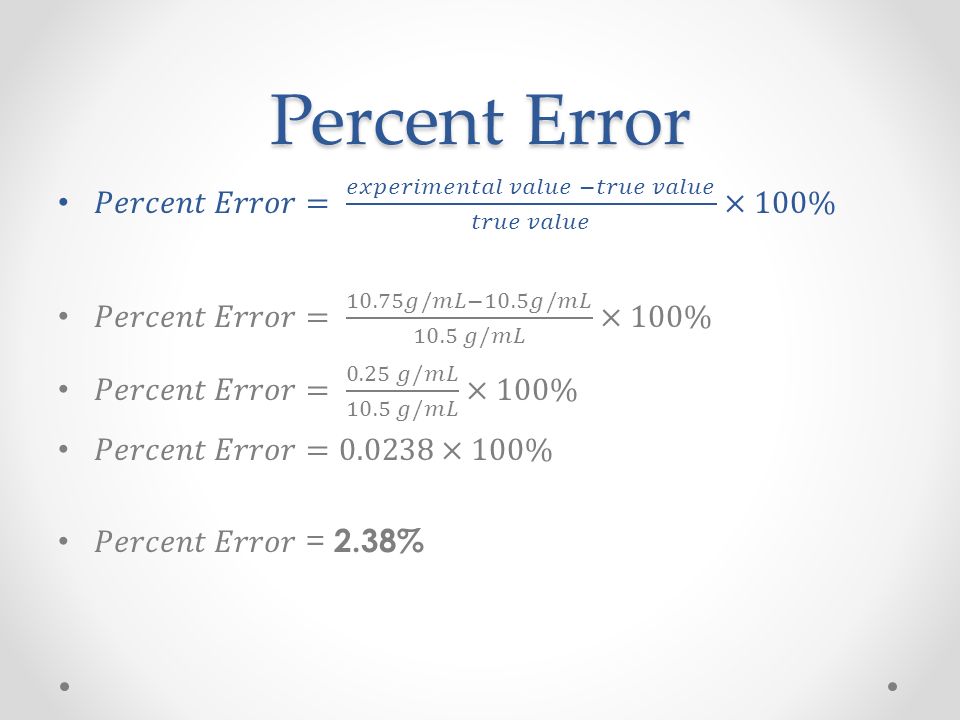
Percent Error

12
Anomalous Data Sometimes you make a data set and one number looks really weird This is anomalous data Anomalous data is useful – it can tell you if your equipment isn’t working right, or maybe you forgot to control for a variable If your averages and percent error are strange, look for anomalous data

13
Questions Any questions about the slides? Any new questions?

Similar presentations


First, order the numbers from least to greatest. 2)Next, add the numbers in the data set. 3)Then,>")


 2.Find the sum of all the numbers in the set. a+b+….+z= Total 3. Count.>")


 - _______ all the values then ________ by the number of values.>")


