Download presentation
Presentation is loading. Please wait.

2
IWBAT summarize data, using measures of central tendency, such as the mean, median, mode, and midrange.

3
Statistic › A characteristic or measure obtained by using the data values from a sample Parameter › A characteristic or measure obtained by using all the data values from a specific population

4
Mean is also known as an arithmetic average. It is found by adding the values of the data and dividing by the total number of values.

5
Sample Mean Population Mean

6
General Rule: › Wait until the end to round. All calculations in between should not be rounded. Rule for Mean: › The mean should be rounded to one more decimal place than the raw data.

7
Using the frequency distribution, find the mean. A Class B Frequency (f) C Midpoint (X m ) D (f)(X m ) 5.5-10.5188 10.5-15.521326 15.5-20.531854 20.5-25.5523115 25.5-30.5428112 30.5-35.533399 35.5-40.523876 n = 20Sum=490 Step 1: Create table Step 2: Find the midpoints of each class. Step 3: For each class, multiply the frequency by the midpoint. Step 4: Find the sum of column D. Step 5: divide the sum by n to get the mean.
 C Midpoint (X m ) D (f)(X m ) n = 20Sum=490 Step 1: Create table Step 2: Find the midpoints of each class. Step 3: For each class, multiply the frequency by the midpoint. Step 4: Find the sum of column D. Step 5: divide the sum by n to get the mean..")
8
The midpoint of the data Symbol for median is MD To find median › Step 1: arrange data in order › Step2 : select the middle point › If there are 2 middle numbers, add the numbers and divide by 2.

9
The number that occurs most often Types of modes › No mode › Unimodal – one mode › Bimodal – 2 modes › Multimodal – more than 2 modes › The mode for grouped data is the modal class. The modal class is the class with the largest frequency.

10
The midrange is the sum of the largest value and the smallest value, divided by 2. The symbol for midrange is MR.

11
To find the weighted mean, multiply each value by its corresponding weight and divide the sum of the products by the sum of the weights.

12
CourseCredits (w)Grade (X) English3A (4 points) Intro to Psychology3C (2 points) Biology I4B (3 points) Physical Education2D (1 point) The grade point average is 2.7.
Grade (X) English3A (4 points) Intro to Psychology3C (2 points) Biology I4B (3 points) Physical Education2D (1 point) The grade point average is 2.7.")
14
Measures of Variation

15
IWBAT describe data, using measures of variation, such as the range, variance, and standard deviation.

16
The range is the highest number minus the lowest number. It is represented by R. One extremely high or one extremely low number can affect the range.

17
The variance is the average of the squares of the distance each value is from the mean. Symbol is 2 Formula is › 2 = ( - ) 2 / › is lowercase sigma › is the individual value › is the mean › is the number of data values The standard deviation is the square root of the variance. Symbol is . Formula is › = 2 = ( - ) 2 /
 2 / › is lowercase sigma › is the individual value › is the mean › is the number of data values The standard deviation is the square root of the variance. Symbol is . Formula is › = 2 = ( - ) 2 / .")
18
Step 1: Find the mean for the data. Step 2: Subtract the mean from each data value. Step 3: Square each result. Step 4: Find the sum of the squares. Step 5: divide the sum by N to get the variance. Step 6: Take the square root of the variance to find the standard deviation.

19
Find the variance and standard deviation of the following data: 10, 60, 50, 30, 40, 20. Step 1: Mean is (10+60+50+30+40+20)/6 210/6 = 35 Step 2: Subtract mean from each data value 10 - 35 = -2560 – 35 = 2550 – 35 = 15 30 – 35 = -540 – 35 = 520 – 35 = -15 Step 3: Square each result. (-25) 2 = 625(25) 2 = 625(15) 2 = 225 (-5) 2 =25(5) 2 = 25(-15) 2 =225
/6 210/6 = 35 Step 2: Subtract mean from each data value = – 35 = 2550 – 35 = – 35 = -540 – 35 = 520 – 35 = -15 Step 3: Square each result. (-25) 2 = 625(25) 2 = 625(15) 2 = 225 (-5) 2 =25(5) 2 = 25(-15) 2 =225.")
20
Step 4: Find the sum of the squares. 625+625+225+225+25+25 = 1750 Step 5: Divide the sum by N to get the variance. Variance = 1750/6 = 291.7 Step 6: Take the square root to get the standard deviation. 291.7 = 17.1 Variance and Standard deviation will never be negative.

21
Find the Variance and Standard Deviation of the following data. 35, 45, 30, 35, 40, 25

22
Variance is 250/6 = 41.7 Standard deviation = 6.5

23
When the means are equal, we need to do more tests to analyze the data. Therefore, we can determine the variability of the data by finding the variance and the standard deviation. Variability is also known as the spread of the data. The larger the variance and the standard deviation the more variable the data is or spread out the data is. For example, in the manufacture of fittings, such as nuts and bolts, the variation in diameter must be small, or parts will not fit together. The standard deviation also tells you how far the data is away from the mean.

24
Process is similar to finding the mean for grouped data. Step 1: Make a table Step 2: Multiply the midpoint by the frequency. Step 3: Multiply the frequency by the square of the midpoint. Step 4: Find the sum of the frequency, step 2 ( m ), and step 3 ( m 2 ). Step 5: Find the variance by using this formula s 2 = n( m 2 )-( m ) 2 n(n-1) Step 6: Take the square root of step 5 to find the standard deviation.
, and step 3 ( m 2 ). Step 5: Find the variance by using this formula s 2 = n( m 2 )-( m ) 2 n(n-1) Step 6: Take the square root of step 5 to find the standard deviation..")
25
ClassFrequencyMidpoint (X m ) m m 2 5.5 – 10.518864 10.5 – 15.521326338 15.5 – 20.531854972 20.5 – 25.55231152645 25.5 – 30.54281123136 30.5 – 35.5333993267 35.5 – 40.5238762888 n = 20 m = 490 m 2 = 13310 s 2 = n( m 2 )-( m ) 2 s = 68.7 = 8.3 n(n-1) s 2 = 20(13310) – (490) 2 20(20-1) s 2 = 266200 – 240100 20(19) s 2 = 26100 380 s 2 = 68.7
 m m – – – – – – – n = 20 m = 490 m 2 = s 2 = n( m 2 )-( m ) 2 s = 68.7 = 8.3 n(n-1) s 2 = 20(13310) – (490) 2 20(20-1) s 2 = – (19) s 2 = s 2 = 68.7")
27
If the units of two sets of data are different we can use the coefficient of variation to compare the standard deviations. The coefficient of variation is the standard deviation divided by the mean and is expressed as a percent. Symbol for the coefficient of variation is CVar. Formula is CVar = s/X times 100%

28
The mean of the number of sales of cars over a 3-month period is 87, and the standard deviation is 5. The mean of the commissions is $5225, and the standard deviation is $773. Compare the variations of the two. Sales = 5/87 times 100% = 5.7% Commissions = 773/5225 times 100% = 14.8% The commissions are more variable than the sales.

29
The mean for the number of pages of a sample of women’s fitness magazines is 132, with a variance of 23; the mean for the number of advertisements of a sample of women’s fitness magazines is 182, with a variance of 62. Compare the variations.

30
The coefficients of variation are › Pages = 23/132 times 100% = 3.6% › Advertisements = 62/182 times 100% = 4.3% › The number of advertisements is more variable than the number of pages.

31
Pg. 137 › 1, 2, 16, 18 – 25, 27 – 31

32
The proportion or percent of values from a data set that will fall within k standard deviations of the mean will be at least 1-1/k2, where k is a number greater than 1. (k is also the number of standard deviations)
.")
34
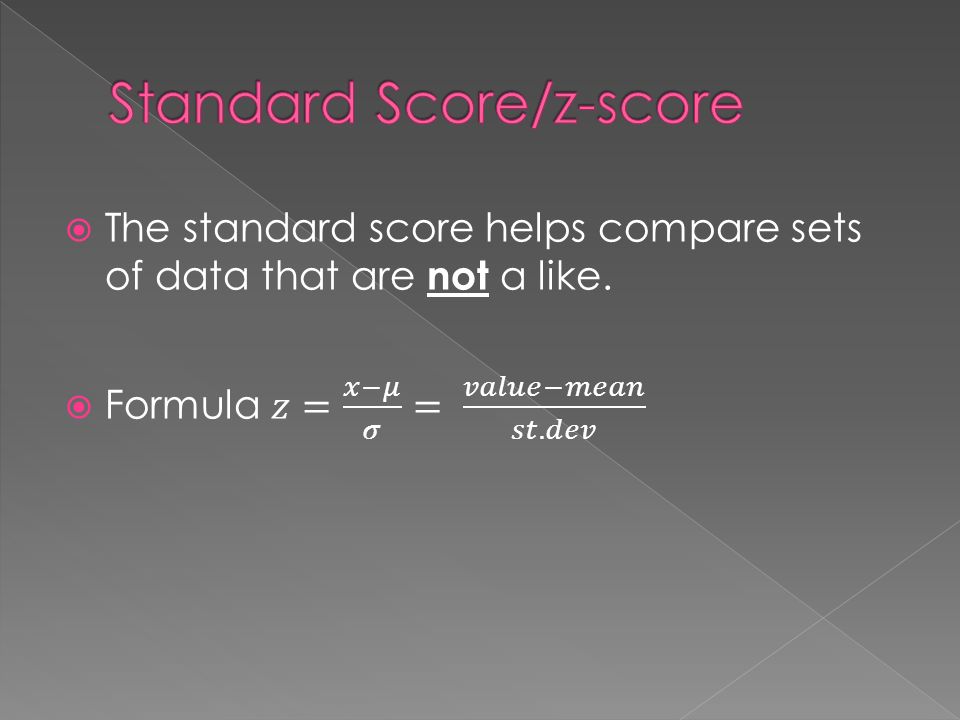
IWBAT identify the position of a data value in a data set, using various methods of position such as standard score, percentiles, deciles, and quartiles.

36
A student scored 65 on a calculus test that had a mean of 50 and a standard deviation of 10. She scored a 30 on a history test that had a mean of 25 and a standard deviation of 5. Compare her relative positions.

38
If the z-score is positive it is above the mean. If the z-score is negative it is below the mean

41
Find the percentile of each number in the data set 2, 4, 7, 8, 9, 12.

42
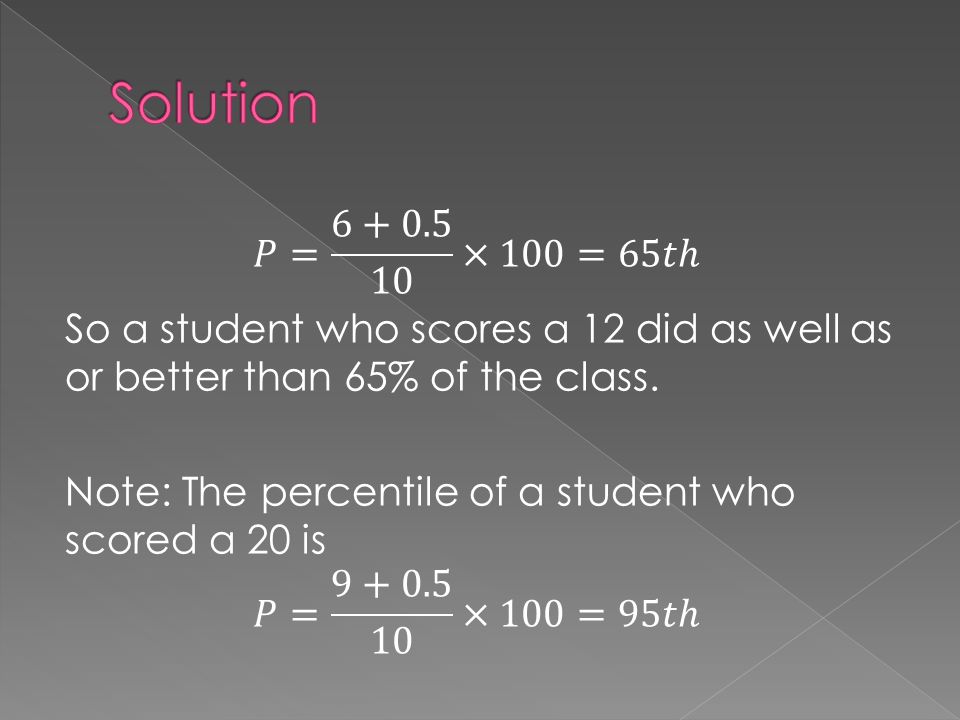
A teacher gives a 20 point test to 10 students. The scores are 18, 15, 12, 6, 8, 2, 3, 5, 20, 10. Find the percentile rank of a score of 12.

47
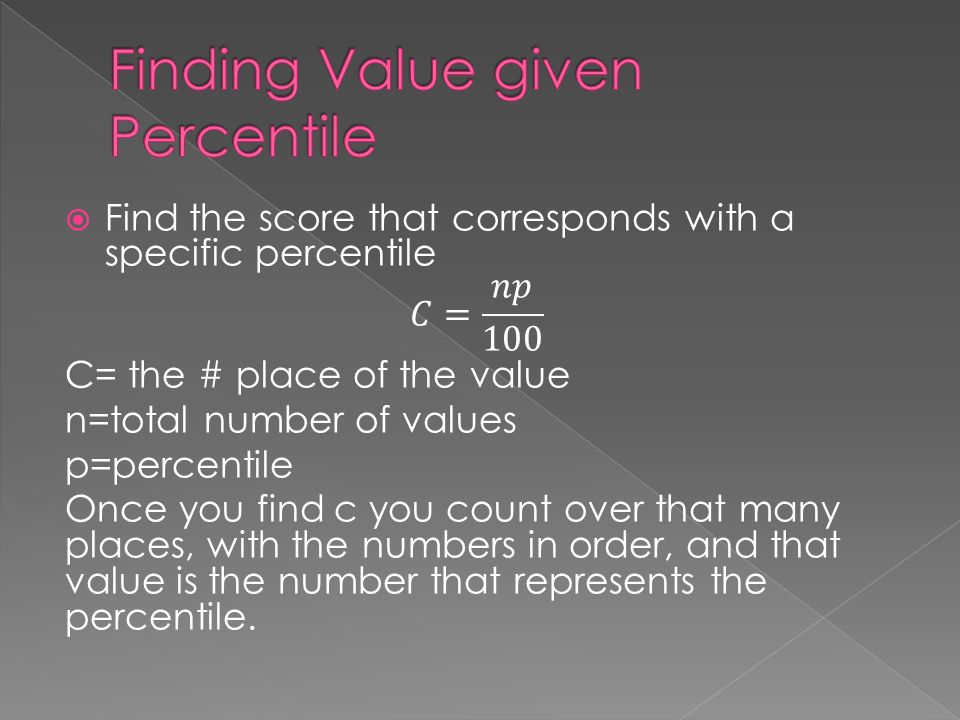
4 parts › Q 1 – 25 th › Q 2 – 50 th › Q 3 – 75 th › Q 4 – 99 th 10 parts › D1 – 10 th › D2 – 20 th › D3 – 30 th › D4 – 40 th › D5 – 50 th › D6 – 60 th › D7 – 70 th › D8 – 80 th › D9 – 90 th › D10 – 99th

Similar presentations