Download presentation
Presentation is loading. Please wait.

1
Titration

2
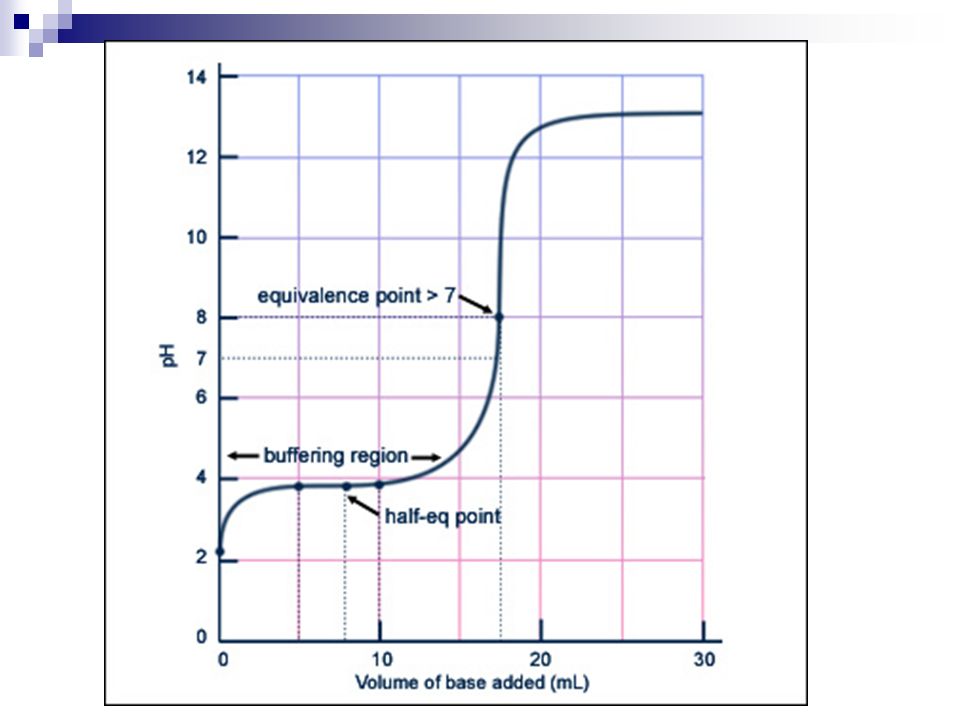
Weak Acid/Strong Base Titration Curve pH starts higher Rapid rise and then levels into a zone where pH doesn’t change much (buffering zone) When enough base added to neutralize ½ acid – called half equivalence pt. (middle of buffer zone and pH = pK a ) pH at equivalence pt is greater than 7
 pH at equivalence pt is greater than 7.")
5
Polyprotic Acid Curves

6
Example Calculate the pH in the titration of acetic acid by NaOH after 30.0ml of.100M NaOH is added to 50.0ml of.100M acetic acid.

7
Example Hydrogen cyanide (HCN), a powerful respiratory inhibitor, is highly toxic. It is a very weak acid (K a = 6.2 x 10 -10 ) when dissolved in water. If a 50.0 mL sample of 0.100 M HCN is titrated with 8.00mL of 0.100 M NaOH a) calculate the number of moles of HCN remaining in the solution b) calculate the molar concentration of CN - in the solution c) calculate the pH of the solution d) calculate the volume of NaOH that must be added to reach the equivalence point e) what will the pH be like at the equivalence point
 when dissolved in water. If a 50.0 mL sample of M HCN is titrated with 8.00mL of M NaOH a) calculate the number of moles of HCN remaining in the solution b) calculate the molar concentration of CN - in the solution c) calculate the pH of the solution d) calculate the volume of NaOH that must be added to reach the equivalence point e) what will the pH be like at the equivalence point.")
8
Example Draw a titration curve for a weak base (pH = 11.5) titrated with a strong acid (pH = 1). On the curve indicate: a) Equivalence point b) Buffering zone c) Where pH = pK b d) Where pH depends only on base e) Where pH depends only on acid
 Equivalence point b) Buffering zone c) Where pH = pK b d) Where pH depends only on base e) Where pH depends only on acid.")
Similar presentations


 is when.>")


 Titrant (0.2 M) Initial pH pH at equivalence point pH at 2X equivalence point X-axis at equivalence point Strong.>")

 = 4.5 x 10 -4.>")

 0.00 mL strong.>")


