Download presentation
Presentation is loading. Please wait.

1
Structural origin of non-Newtonian rheology Computer simulations on a solution of telechelic associating polymers J. Stegen +, J. Billen°, M. Wilson °, A.R.C. Baljon °. A.V. Lyulin + + Eindhoven University of Technology (The Netherlands) ° San Diego State University (USA)
 ° San Diego State University (USA).")
2
Introduction

3
Polymeric gels Reversible junctions between end groups (telechelic associating polymers) Temperature SolGel Concentration
 Temperature SolGel Concentration")
4
Constitutive relation for gel Stress Shear rate Viscosity Constitutive relation for gel Regime where stress decreases with increasing shear due to shear induced structure: decrease in number of elastic junctions increased orientation in shear direction shear rate stress

5
Hybrid MD/MC simulation of a polymeric gel

6
Molecular dynamics simulation Molecular dynamics: Grest-Kremer bead-spring model Equations of motion: (Langevin equation, coupling to heat bath through fluctuation dissipation theorem)
")
7
Bead-spring model [K. Kremer and G. S. Krest. J. Chem. Phys 1990] 11 Distance U Repulsion all beads Attraction beads in chain

8
Associating polymer Junction between end groups : LJ + FENE + Association energy [A. Baljon et al., J. Chem. Phys., 044907 2007] U bond U nobond U Distance

9
Dynamics of associating polymer Monte Carlo: attempt to form or destroy junction P<1 possible form P=1 form Distance U assoc =-22 U

10
Simulation details 1000 polymeric chains, 8 beads/chain Units: (length), (energy & temperature), m (mass), (m/ (time); Box size: (23.5 x 20.5 x 27.4) with: periodic boundary conditions in x,y direction. Fixed walls in z-direction Average volume density in system: 0.32 NVT simulation

11
Shearing the system Move wall with constant shear rate. Some chains grafted to wall to minimise wall slip (50 per wall) fixed wall moving wall
 fixed wall moving wall.")
12
Nomenclature Bead (8 per chain) Chain bead (6 per chain, white/gray) End group (2 per chain) Dangler (blue) Loop (orange) Aggregate (red & orange) Single chain Network structure of 4 chains
 Chain bead (6 per chain, white/gray) End group (2 per chain) Dangler (blue) Loop (orange) Aggregate (red & orange) Single chain Network structure of 4 chains")
13
Structural properties in equilibrium

14
Structural properties in mechanical equilibrium I phase# aggregates# loops# danglers T=1.0Solution390 ± 1167 ± 8593 ± 23 T=0.55Gel transition198 ± 7184 ± 12151 ± 11 T=0.35Gel107 ± 4257 ± 462 ± 4

15
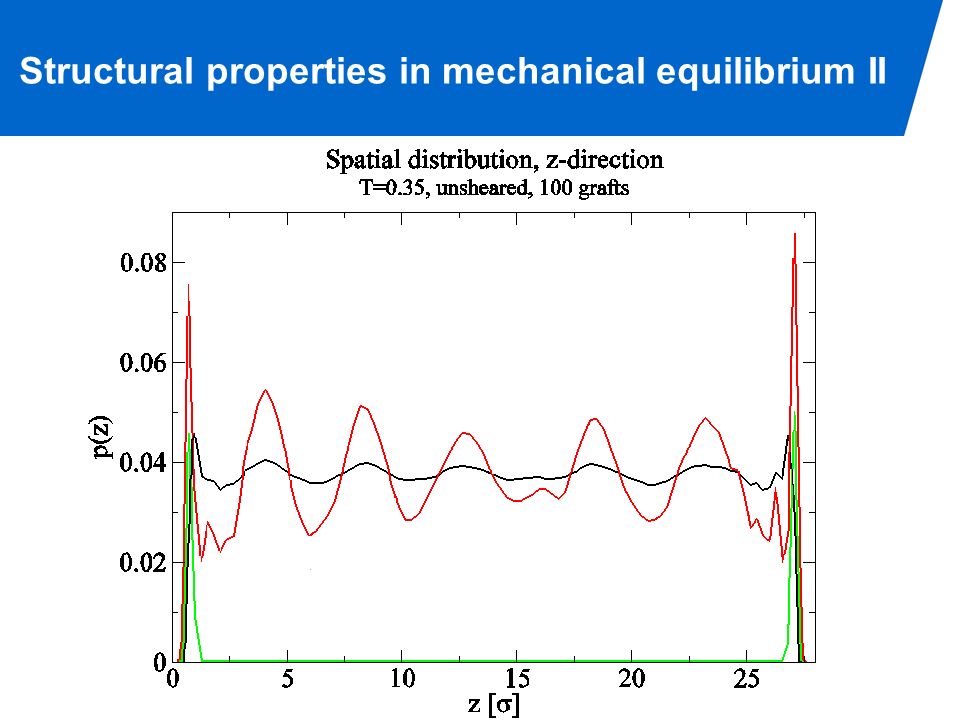
Structural properties in mechanical equilibrium II

17
Structural properties in mechanical equilibrium III T=1.0

18
Structural properties in mechanical equilibrium III T=0.55

19
Structural properties in mechanical equilibrium III T=0.35

20
Structural properties in mechanical equilibrium IV: Conclusions Aggregates increase in size with decreasing temperature Gel network immobile, macroscopic lifetime Spatial ordering of aggregates observed in gel phase Boundary effects visible at all temperatures, induces structure and ordering at lower temperature

21
Shear Banding

22
Shear banding: theory Instable region in constitutive relation (striped) Stable configuration through two shear bands coexisting at a stress σ Lever rule: Plateau in shear-stress curve Difference in mesoscopicstructure between bands
 Stable configuration through two shear bands coexisting at a stress σ Lever rule: Plateau in shear-stress curve Difference in mesoscopicstructure between bands")
23
Shear banding: force and velocity profile Simulation details: T=0.35ε wall velocity 0.01 σ/τ shear rate 3.6*10 -4 τ -1 total wall displacement ~700 σ

24
Shear banding: aggregate size distribution More small and large aggregates in shear banding state Large aggregates strong influence on velocity profile?

25
Shear banding: orientation function Orientation in xx-direction, xz-direction and perpendicular to zz-direction: effects of applied shear on chains decrease No significant differences between shear bands xx zz xz

26
Shear banding: spatial distribution High shear band very small (~5σ), too small to contain mesoscopic structure? Fluctuations in density of ~10% at bottom of high shear band. No stationary flow but hopping like behaviour of end groups at interface? Shear direction

27
Conclusion Shear bands in velocity profile observed. High shear band too small to accommodate a mesoscopic structure different from the low shear band. No significant differences in structure observed between bands. More large aggregates in a sheared system, these could be responsible for the observed shear banding. Fluctuations in end-group density at interface, no steady flow. Validity of lever rule has not been checked. Uncertain if observed shear banding corresponds to the shear banding observed in experiment.

28
Other work… Jammed system at constant stress & fluctuation relation Elastic behaviour visible Two types of behaviour observed in time Deviations from fluctuation relation observed

29
Questions?

Similar presentations


 Earthquake Energy Balance>")


. Our results suggest that for a given liquid the normal.>")
 Democratic motion Conclusions G. Appignanesi, J.A. Rodríguez Fries, R.A. Montani.>")

