Download presentation
Presentation is loading. Please wait.

2
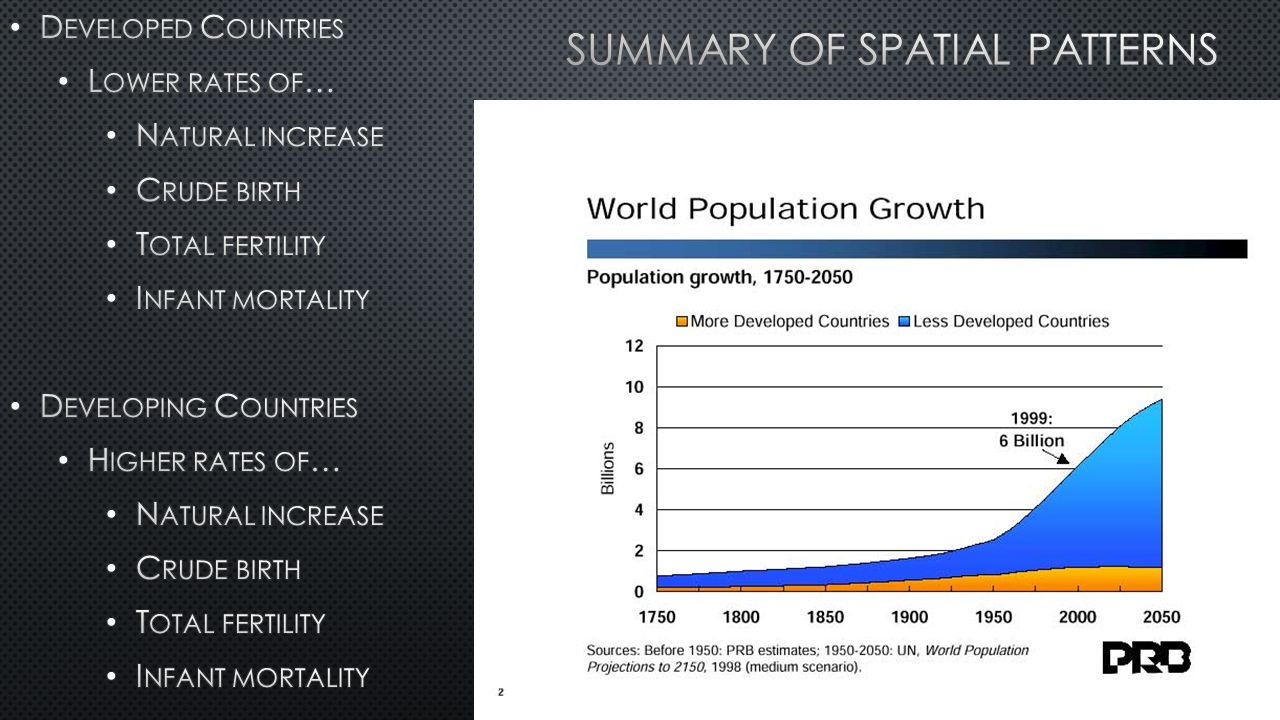
Population: Where are we? Where are we going? Densities and Distributions Composition Age Race Gender Ethnicity Effects of Natural Phenomena Growth and Decline Theories Trends Movement and Migration

11
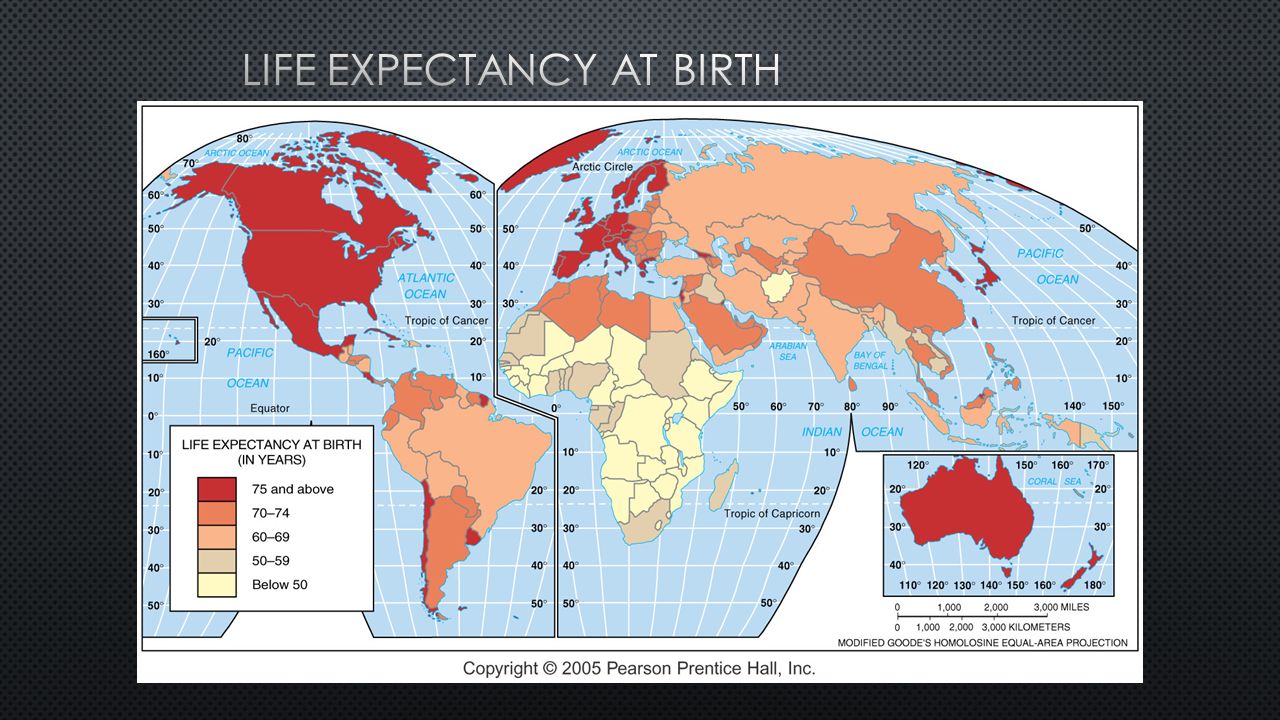
Fig. 2-10: The infant mortality rate is the number of infant deaths per 1,000 live births per year. The highest infant mortality rates are found in some of the poorest countries of Africa and Asia.

21
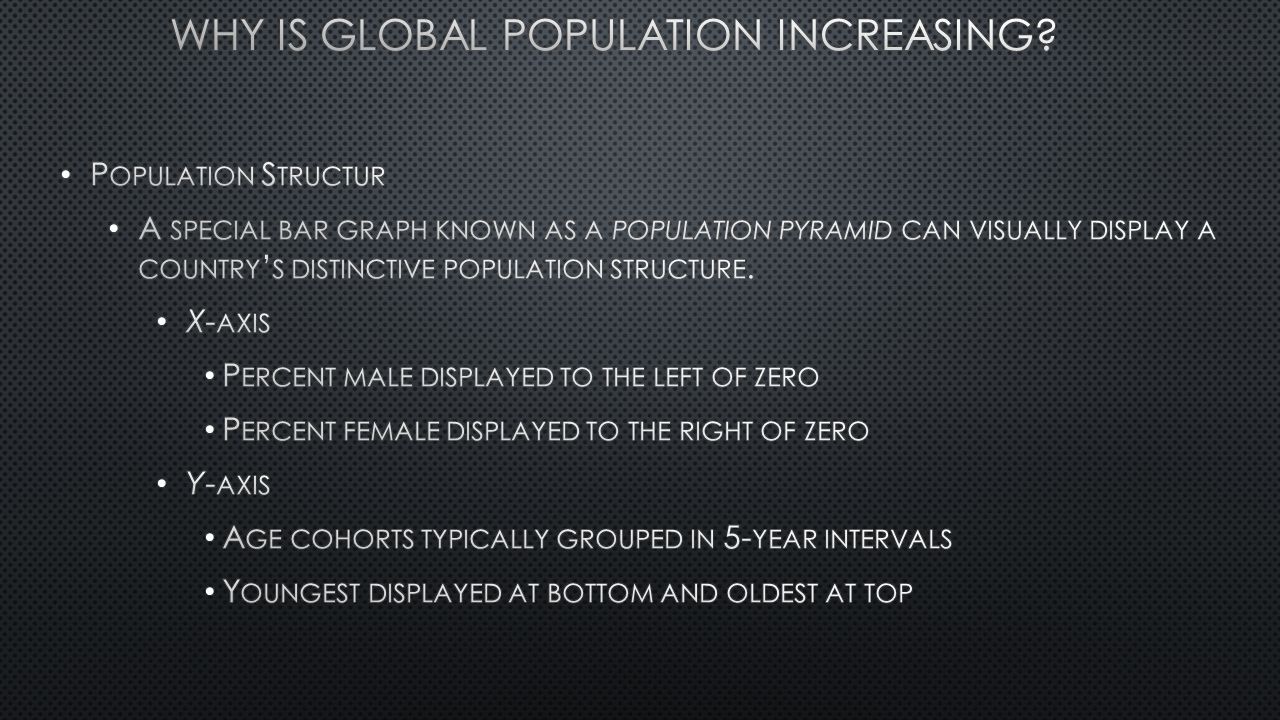
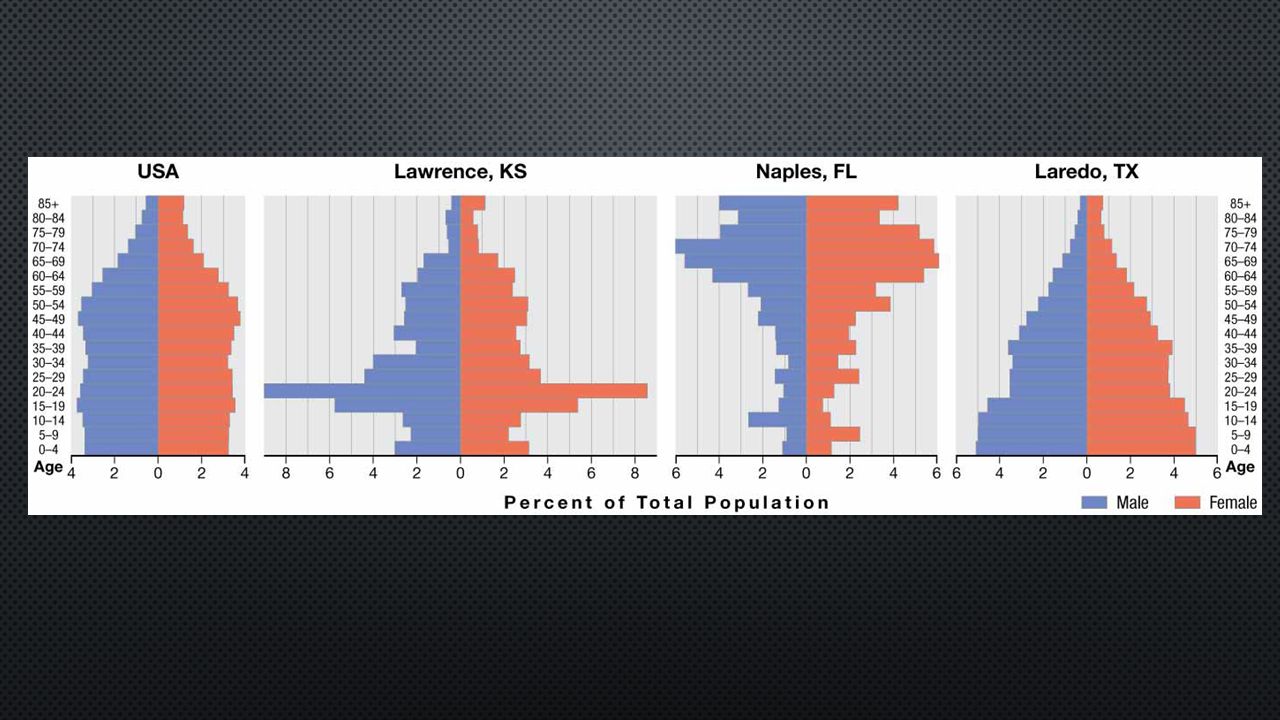
MaleFemale 0-4 3.43.3 5-9 3.73.6 10-14 3.73.6 15-19 3.73.5 20-24 3.43.3 25-29 3.53.4 30-34 3.73.6 35-39 4.0 40-44 4.0 45-49 3.53.6 50-54 3.13.2 55-59 2.32.5 60-64 1.82.0 65-69 1.61.8 70-74 1.41.5 75-79 1.11.5 80-84.651.1 85-89.31.67 90+.12.39

Similar presentations


 Mr Elliott SSOT.>")


