Download presentation
Presentation is loading. Please wait.

1
A. Larabi, M. Faouzi and A. Cheng LIMEN, Ecole Mohammadia d’Ingénieurs, Rabat Department of Civil Engineering, University of Mississippi, USA e-mail : larabi@emi.ac.ma www.emi.ac.ma/mawarid/ Assessment of Groundwater Resources in Rmel Coastal Aquifer (Morocco) by SEAWAT
 by SEAWAT.")
2
DEVELOPMENT OF A NUMERICAL MODEL FOR SIMULATING SALT WATER INTRUSION IN THE RMEL COASTAL AQUIFER USE OF THE MODEL AS A MANAGEMENT TOOL FOR PLANNING AND WATER RESOURCES MANAGEMENT IN THE AQUIFER

5
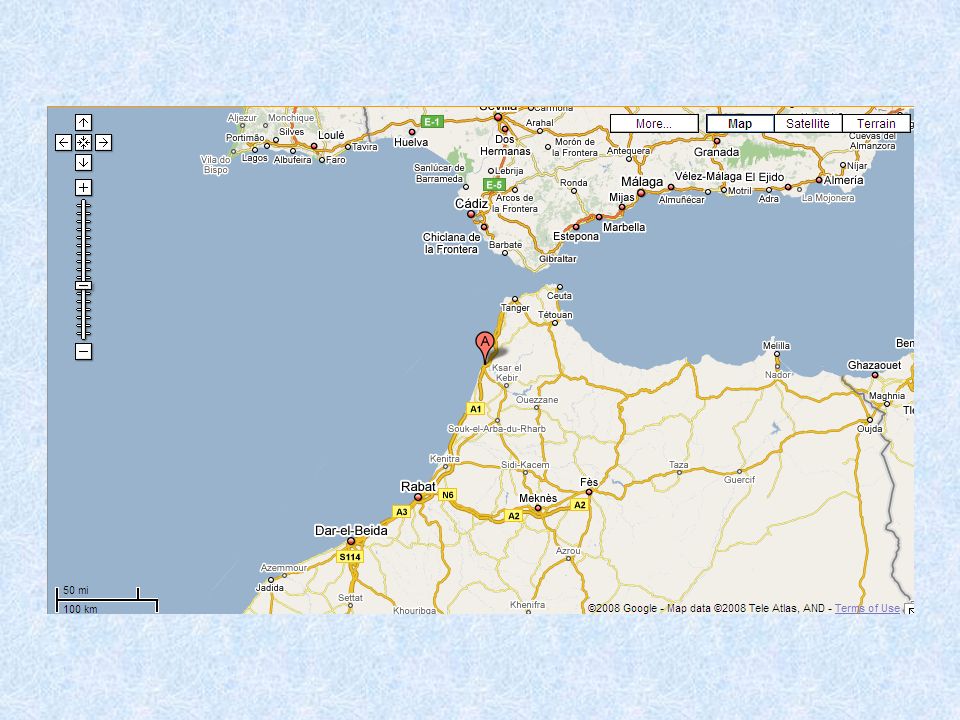
Location map of the study area. area : 240 km 2 ; 20 Km along the atlantic coast

6
HYDROCLIMATIC CONTEXT Semi-arid with oceanic influence; The average annual precipitation: 695 mm. 90% are recorded between November and April; the average monthly temperature ranges from 12°c in January to 24°c in August ; The average ETP : 467 mm (DRPE, 1987)
.")
7
Aquifer importance : used for drinking water supply for rural areas, Larache and Ksar El Kebir cities, and Irrigation of the Bas Loukkos plain Salt water intrusion advances aquifer’s Water quality degradation Need of optimum management to protect water resources Important water table decrease Overexploitation + Recurrent drought Hydro-agricultural development and drinking water supply threatened

8
Work was commissioned by Direction de la Recherche et de la Planification des Eau

9
Map of the aquifer bottom Regular along the Atlantic coast (located between - 25 and - 50 m ASL); existence of a large basin (R' hamna) in the East where the depth of the substratum reaches a value of - 90 m ASL; In the south, the substratum of the aquifer rises to form a high bottom (watershed).
; existence of a large basin (R hamna) in the East where the depth of the substratum reaches a value of - 90 m ASL; In the south, the substratum of the aquifer rises to form a high bottom (watershed).")
10
Piezometric map of the steady state (1972) The flow is generally directed South-west towards the North-East with a component directed towards the ocean; General trend is modified on the north by important local abstractions of ONEP resulting in a cone of depression) and along the rivers and slopes where the aquifer is drained permanently (presence of springs and Merjas). ;

11
Piezometric map 2000 Intensive local pumping near the coast (field abstraction of ONEP and SODEA) inversion of the direction of local fluxes from the sea towards the continent, resulting in a start of seawater intrusion.
 inversion of the direction of local fluxes from the sea towards the continent, resulting in a start of seawater intrusion.")
12
SEAWATER INTRUSION MEASUREMENTS : Salinity and piezometry evolution in the coastal piezometers

13
Pz 1535/3 and 1536/3 don’t not show variation of the concentration between the bottom and the top, however Pz 1533/3 and 1534/3 did; Peaks corresponding to January 1990 coinciding with the intensive abstraction of the ONEP well field at the North (88-90) associated to the beginning of reduced recharge of the aquifer (period 91-95), due to droughts. SEAWATER INTRUSION :

14
Modeling Processes Step 1: Identification of the information required for making management decisions Step 2: Development of a conceptual model Step 3: Development of a mathematical model Step 4: Development of a numerical model and computer code

15
Step 5: Code verification Step 6: Model validation Step 7: Model calibration and parameter estimation Step 8: Model application Step 9: Sensitivity analysis Step 10: Stochastic analysis

16
DEVELOPMENT OF A MATHEMATICAL MODEL FOR SIMULATING SEAWATER INTRUSION

17
: SEAWAT A Computer Program For Simulation of Three-Dimensional Variable-Density Ground-Water Flow (U.S.G.S.F) MODFLOW MT3DMS Hydrodynamic Model for variable density Solute Transport Model -div ( V ) + q s = S p P + n C t C t V = -k ( grad P + g grad z) µ = 0 (1 + )c N D ij C - (V i C) + q s C s + R k x i x j x i n k=1 Dispersion Advection Recharge/ Réactions Décharge Chimiques C = t THE NUMERICAL CODE FOR MODELING SEWATER INTRUSION
 MODFLOW MT3DMS Hydrodynamic Model for variable density Solute Transport Model -div ( V ) + q s = S p P + n C t C t V = -k ( grad P + g grad z) µ = 0 (1 + )c N D ij C - (V i C) + q s C s + R k x i x j x i n k=1 Dispersion Advection Recharge/ Réactions Décharge Chimiques C = t THE NUMERICAL CODE FOR MODELING SEWATER INTRUSION")
19
The grid consists on 31 Columns, 42 Rows and 4 Layers generating 3216 regular square active cells of 500 m. CONCEPTUAL MODEL Mesh and Boundary conditions. : Inactive Cells : Cells with fixed potential and concentration Drainage Legend : columns

20
CONCEPTUAL MODEL Control Network for the observation wells 8 observation wells covering the field are available and whose majority concentrate in the North and the Center of the study zone compare the piezometric levels simulated and measured vs time Distribution of the piezometric observation points in the modelled field

21
Calculated piezometry calibration of the R' mel aquifer model in steady state (1972) Correlation between measured and simulated values The main piezometric structure of flow is well represented; The difference between calculated and measured gw levels ranges between 1 and 1.5 m for observation network; The calibration is more reliable in the North-western sectors and center-East where we have piezometric data
 Correlation between measured and simulated values The main piezometric structure of flow is well represented; The difference between calculated and measured gw levels ranges between 1 and 1.5 m for observation network; The calibration is more reliable in the North-western sectors and center-East where we have piezometric data")
22
Simulated water budget in SS Balance components Volumes m 3 /day discharge l/s input recharge by precipitation119978.351388.64 Return from irrigation22852.80264.50 Total146206.501692.21 output Agricultural withdrawls31622.40366.00 Domestic water supply 8640.00100.00 Sea outflow30746.06355.86 River drainage : Smid El Ma-El Kihel-Sakh Sokh71878.37831.93 Total142886.831653.78 Error (%) 3*10 -4 82% des entrées 28.2% des sorties 50.3% des sorties 21.5% des sorties Table 1: Calculated water balance in steady state (1972).
 3* % des entrées 28.2% des sorties 50.3% des sorties 21.5% des sorties Table 1: Calculated water balance in steady state (1972).")
23
THE TRANSIENT MODEL OBJECTIVES Find out the starting period of Saltwater intrusion, and follow-up its evolution and its extent Quantify the SWI inflow and the other balance terms Identify the invaded zones by SWI and estimate the contamination degree

24
The model calibration was carried out over the period 1973-1984 A verification of the model was carried out over the period 1985-1996 Simulation of the model over the period 1997-2003 was carried out by considering that the stresses are the same as those characterizing the series 1985-1996 TRANSIENT MODEL

25
Transient water budget Reserve increases between 1972-1980: 2.93 Mm3/year between 1972-1975 and of 1.615 Mm3/year between 1975-1980; Water budget terms Mm 3 /an 19721975198019851990199520002003 InputInput Storage 08.78757216.8616821.0390730.00541113.3648326.9510493.885342 Return from irrigation 0.577109 16.466720 sea water Intrusion 0.0000000.0056700.0124740.0040970.0001750.7364632.1168842.657511 Recharge by precipitation 43.79209912.6488306.27553522.52185626.5292913.9249997.246354 Total 44.36920722.01918123.72679940.03174643.00159734.49301332.78100630.255927 OutputOutput destocking 0005.2822565.21428700.0004910 Net pumping 6.931613 6.182633 11.98519613.237976 Sea outflow 11.2223145.2437545.11404210.72499412.0061487.8206007.3863856.896315 River drainage : Smid El Ma-El Kihel-Sakh Sokh 26.235607 9.84292911.68002517.83946419.59596214.67040612.15400810.119584 Total 44.38953322.01829723.72567940.02934842.99902834.47620132.77886030.253875 Error en % 0.046 0.0040.0050.006 00.007 Pronounced destocking between 1980-1985 of 4.22 Mm3/year, which continued until 1990 but with an average of 0.2 Mm3/year;

26
1980-1985 : Reduction of the Recharge by precipitation (period of drought), although water returns from surface irrigation increases (0.6 mm3 in 1980 to 16.5 mm3 in 1985); Increase in Sea outflow and River drainage After 1997: destocking of the aquifer reserves,due to the increase in ONEP’s withdrawals which increased from 184 l/s in 1995 to 223.72 l/s in 2000; 1990-1997: increase in the reserves (3.7 Mm3/year), although the development of ONEP’s withdrawals (new pumping wells); 1985-1990 : decrease of the aquifer destocking because of the return to the climate natural conditions of water supply, in addition to contribution of surface water for the irrigation; Transient water budget
, although water returns from surface irrigation increases (0.6 mm3 in 1980 to 16.5 mm3 in 1985); Increase in Sea outflow and River drainage After 1997: destocking of the aquifer reserves,due to the increase in ONEP’s withdrawals which increased from 184 l/s in 1995 to l/s in 2000; : increase in the reserves (3.7 Mm3/year), although the development of ONEP’s withdrawals (new pumping wells); : decrease of the aquifer destocking because of the return to the climate natural conditions of water supply, in addition to contribution of surface water for the irrigation; Transient water budget")
27
Sea water Intrusion Seawater intrusion started since 1992 following the increased development of ONEP’s withdrawals for the Drinking water supply of Larache; Reduction of the seawater intrusion between 1995-1998 : wet period From 1998, development of the seawater intrusion, because of the recharge reduction associated with increase of the ONEP pumping Seawater intrusion is very sensitive to the fluctuations of water supply and the increase in withdrawals Quantitative evolution of seawater intrusion, natural recharge and withdrawals in the R’mel aquifer.

28
b) Calculated salinity in 2000 for layer 2a) Calculated salinity in 1996 for layer 2 zone located at the immediate West of ONEP well field and pumping increased since 1992 seawater intrusion salinity exceeds 2 g/l in layer 2 where the well filters are located Extension of the invaded zone by seawater intrusion which becomes 2 times between 1996 and 2000 seawater intrusion
 Calculated salinity in 2000 for layer 2a) Calculated salinity in 1996 for layer 2 zone located at the immediate West of ONEP well field and pumping increased since 1992 seawater intrusion salinity exceeds 2 g/l in layer 2 where the well filters are located Extension of the invaded zone by seawater intrusion which becomes 2 times between 1996 and 2000 seawater intrusion")
29
Satisfactory Model Results Support Tool for Water Resources Planning and Management in the area

30
SIMULATING PREVISIONAL SCENARIOS FOR WATER RESOURCES MANAGEMENT OF THE AQUIFER 3 scenario schemes have been applied in order to assess quantitative and qualitative impact of the aquifer : Scenario 1 : Keeping the present aquifer exploitation. The exploitation Volume is about 13.24 Mm 3 /year untill 2020. Scenario 2 : ONEP’s withdrawals from the existing well field which should satisfy DWS demand of the Larache agglomerations projected for 2020; Scenario 3 : Satisfy the maximum demands projected for the DWS for Larache and Ksar El Kebir cities until 2020.

31
b) Calculated salinity for Scenario1 in layer 4 a) Calculated salinity for Scenario1 in layer 2 Results are in agreement with observations and show that the contaminated zone by seawater intrusion continues to extend more; Salinity in water is much higher on the level of layer 2 than layer 4 and this due to the overexploitation in layer 2 (location of the filters);
 Calculated salinity for Scenario1 in layer 4 a) Calculated salinity for Scenario1 in layer 2 Results are in agreement with observations and show that the contaminated zone by seawater intrusion continues to extend more; Salinity in water is much higher on the level of layer 2 than layer 4 and this due to the overexploitation in layer 2 (location of the filters);")
32
ONEP’s well field will be reached by seawater intrusion and the concentration would be of 1g/l Seawater intrusion volume would decrease in scénario 1 since 2003 to reach a steady state beyond the year 2020 Previsional Volumes of seawater intrusion Volume (Mm 3 /an) year Scenarios 20042005201020152020 Scenario 1 1.50681.24800.79080.44920.3905 Scenario 2 2.99963.75444.54574.72734.9428 Scenario 3 3.01393.81454.78605.09615.7462 c) Transversal section of simulated salinity in row 9 of the model for Scenario 1 (2020)
 year Scenarios Scenario Scenario Scenario c) Transversal section of simulated salinity in row 9 of the model for Scenario 1 (2020)")
33
b) Calculated salinity for Scenario 2 in layer 4 a) Calculated Salinity for Scenario 2 in layer 2 (2010) Considerable increase in the salinity in layer 2 (values generally range between 15 and 25 g/l); ONEP’s well field would be already reached by the seawater intrusion front in 2010 and the concentration would be of 1.5 g/l;
 Calculated salinity for Scenario 2 in layer 4 a) Calculated Salinity for Scenario 2 in layer 2 (2010) Considerable increase in the salinity in layer 2 (values generally range between 15 and 25 g/l); ONEP’s well field would be already reached by the seawater intrusion front in 2010 and the concentration would be of 1.5 g/l;")
34
b) Calculated salinity for Scenario 3 in layer 4 (2010) a) Calculated salinity for Scenario 3 in layer 3 (2010) Plume distribution is almost identical for scenario 2 and 3, but the RADEEL’s well field (to supply the city of Ksar El Kebir), located at the south of the ONEP wells would not be contaminated, although with the pumping increase, because it is far from the coast;
 Calculated salinity for Scenario 3 in layer 4 (2010) a) Calculated salinity for Scenario 3 in layer 3 (2010) Plume distribution is almost identical for scenario 2 and 3, but the RADEEL’s well field (to supply the city of Ksar El Kebir), located at the south of the ONEP wells would not be contaminated, although with the pumping increase, because it is far from the coast;")
35
For scenario 1 (maintenance of the current conditions), the ONEP well field would be already contaminated by seawater around 2020; C/C : Simulated results Impact of these scenarios on the groundwater quality: pumping increase in scenario 2 and 3 would accelerate seawater intrusion advance, which would reach the ONEP well field in 2010; and would more accentuate the deterioration of groundwater quality to higher concentrations. Groundwater quality varies badly in the Western Northern coastal part of the aquifer;

36
We conclude that the water demand projected in 2020 would lead to negative impact, resulting in seawater intrusion at the noth western part of the studied area. If no measures and actions are taken, the ONEP well field and the coastal agricultural area will be abundoned. Improvement of the situation will be reinforced by the surface water use for irrigation of the coastal sectors and artificial recharge of the aquifer. This will improve significantly the groundwater quality in the coastal sectors of the aquifer and will protect freshwater from seawater intrusion.

Similar presentations


, Taiwan Professor Yih-Chi TanProfessor Yih-Chi Tan Department of.>")


