Download presentation
Presentation is loading. Please wait.

1
Heating & Cooling Curves Heat vs. Temperature graphs

2
Temperature The differences between solids, liquids and gases can be explained by the particle model: - All substances are made up of particles (atoms, ions or molecules) These particles are attracted to each other, some strongly and others weakly kinetic These particles move around (i.e. have kinetic energy) The kinetic energy of particles increases with temperature
 The kinetic energy of particles increases with temperature.")
3
Temperature

4
What is the heating curve? The heating curve is a graph which represents how a sample changes phases. As heat is added over time, the sample changes temperature and phase accordingly. Thus heating curve.

5
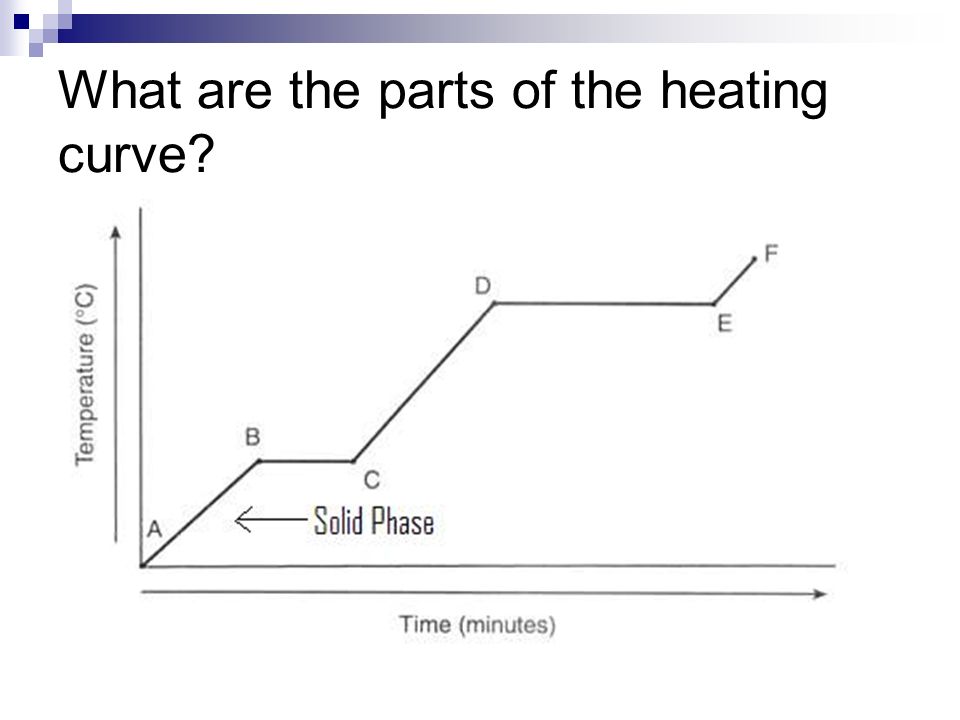
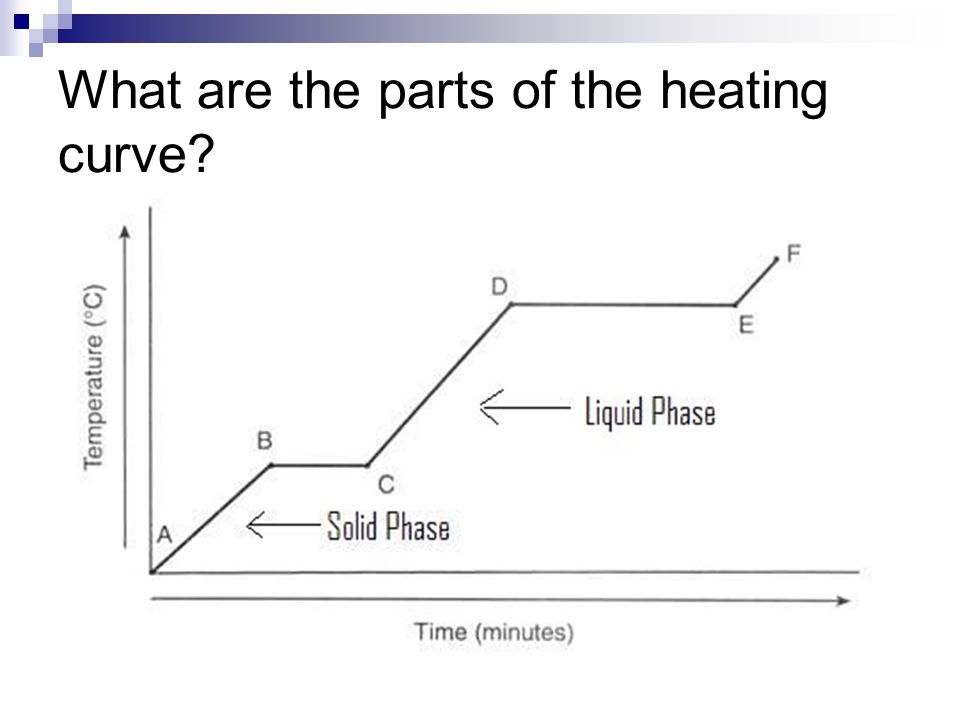
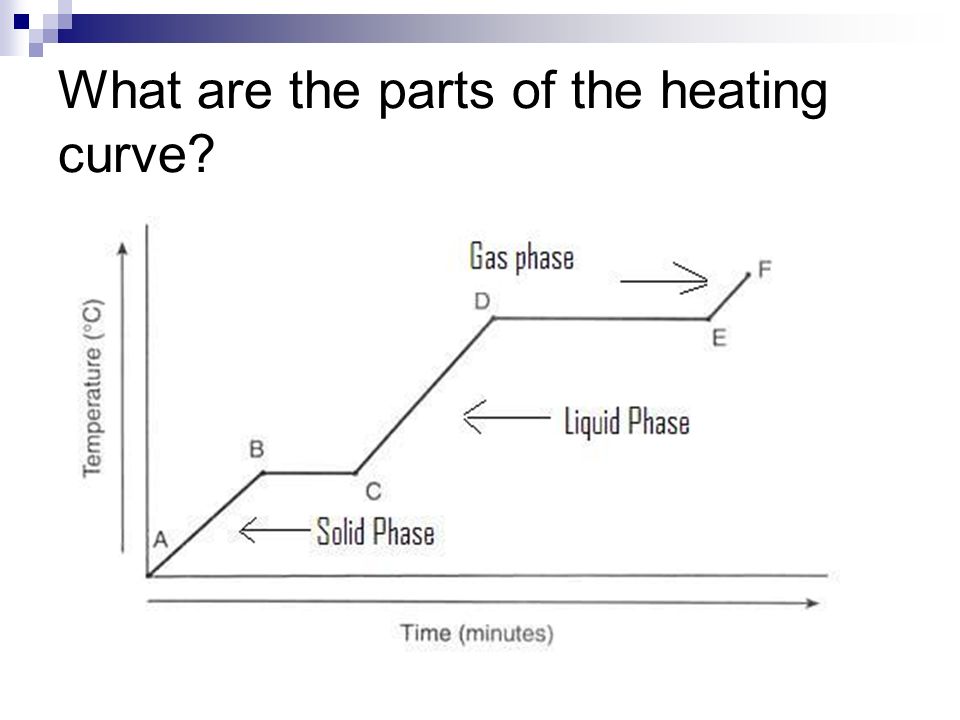
What are the parts of the heating curve?

11
Why is the curve flat at some portions? Temperature is staying constant, but potential energy is decreasing During this time the solid completely becomes liquid (or liquid becomes solid)
.")
12
Why is the curve flat at some points? This is called the heat of fusion (H f ) in segment BC and heat of vaporization (H v ) in segment DE. Remember fusion is melting and vaporization is evaporation
 in segment BC and heat of vaporization (H v ) in segment DE. Remember fusion is melting and vaporization is evaporation.")
13
What is heat of fusion? What is heat of vaporization? H f is the amount of energy needed to completely make a solid into a liquid H v is the amount of energy needed to completely make a liquid into a gas

14
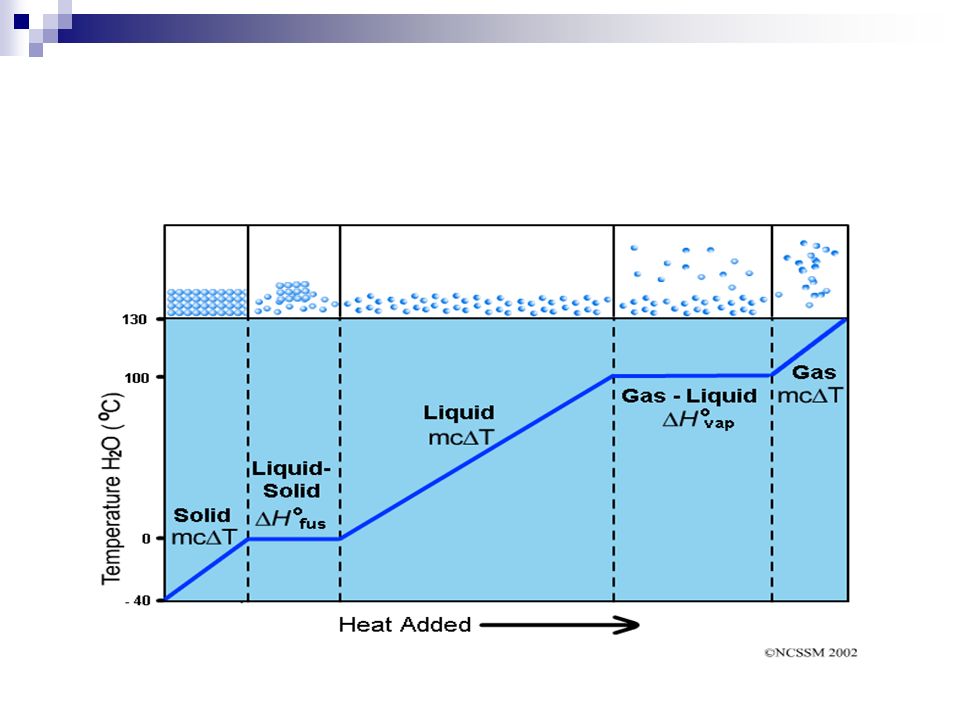
Heating Curves Water heating curve

15
Cooling Curves Stearic cooling curves Cooling curves have horizontal flat parts where the state changes from gas to liquid, or from liquid to solid Stearic acid has a melting point of about 69°C - the temperature stays the same as the liquid freezes

18
Temperature Change What happens to the temperature of stearic acid as it freezes? Your task is to measure the temperatures of the stearic acid as it cools every 30 seconds (as well as noting the state of the stearic acid (solid, liquid, gas)): - Time (seconds)Temperature ( o C)State (solid / liquid / gas) 0 30 60 90 120 Etc…
): - Time (seconds)Temperature ( o C)State (solid / liquid / gas) Etc….")
19
Temperature Change What happens to the temperature of a block of ice when a medium constant heat is applied to it? Your task is to measure the temperatures of the ice as it is heated every 30 seconds (as well as noting the state of the water (solid, liquid, gas)): - Time (seconds)Temperature ( o C)State (solid / liquid / gas) 0 30 60 90 120 Etc…
): - Time (seconds)Temperature ( o C)State (solid / liquid / gas) Etc….")
Similar presentations


 Phase Changes Heating Curves MATTER.>")
: Strong attractive forces hold particles in fixed location. Regular definite geometric shape; crystalline Liquid phase (l): Particles have.>")


. In these.>")


 is called a ______.>")


