Download presentation
Presentation is loading. Please wait.

1
Regression Lines

2
Today’s Aim: To learn the method for calculating the most accurate Line of Best Fit for a set of data

3
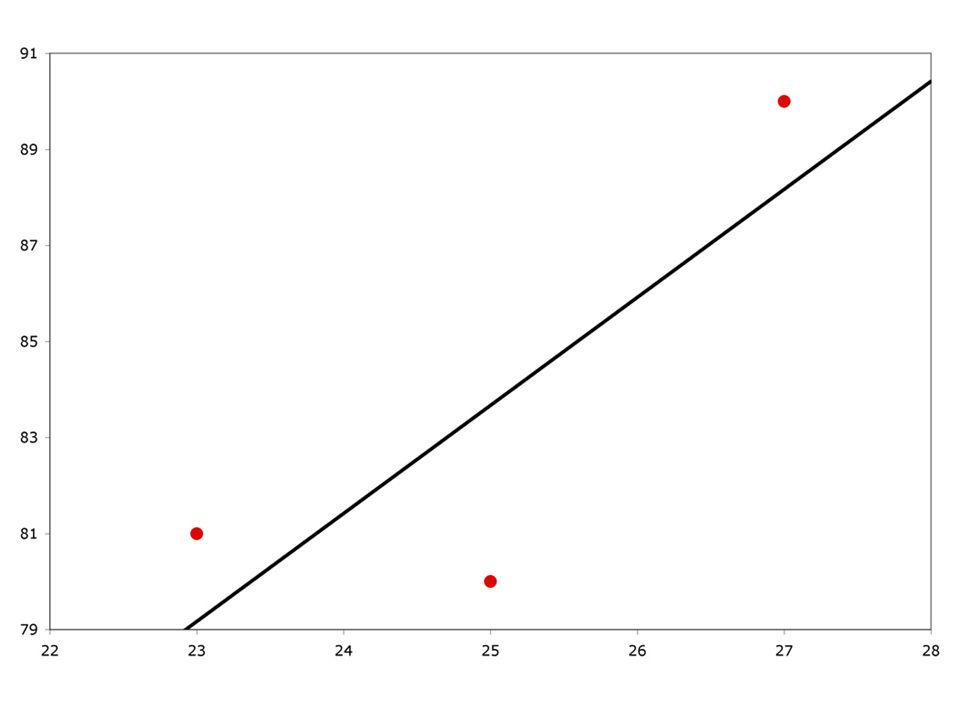
Make a Scatterplot of the following data: XY 2381 2580 2790

5
Lets guess where the Line of Best Fit should go

7
Now we want to measure the distance between the actual Y values for each point and the predicted Y value on our possible Line of Best Fit

9
Now, lets try with a different line…

11
We can also measure with numbers the vertical distances between the Scatterplot points and the Line of Best Fit

12
Actual y values: 81 80 90 81 80 90 Predicted y values: 79.1 83.6 88.2 79.1 83.6 88.2 Difference in y values:.9 3.6 1.8.9 3.6 1.8.9 3.6 1.8 6.3

13
For the first possible Line of Best Fit, the sum of the vertical distances (errors) was 6.3
 was 6.3")
14
81 80 90 79.6 83 85.2.4 3 4.8.4 3 4.8 8.2
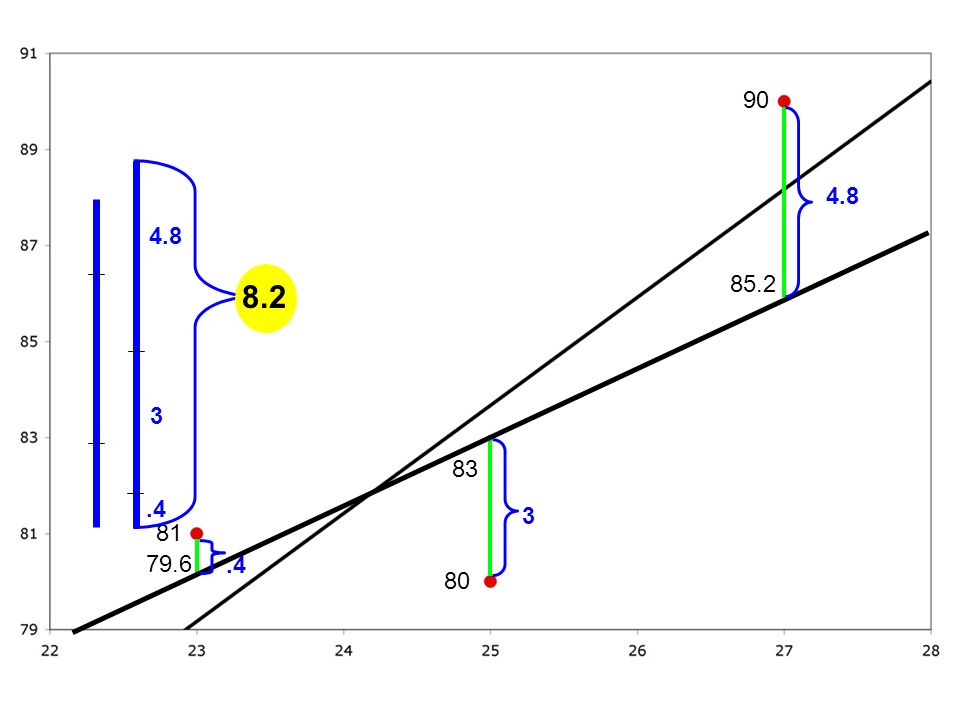
15
The sum of the vertical distances (errors) on the second possible line was 8.2.
 on the second possible line was 8.2.")
16
The correct Line of Best Fit is called a Regression Line.

17
A Regression Line is the line that makes the sum of the squares of the vertical distances (errors) of the data points from the line as small as possible.
 of the data points from the line as small as possible.")
18
To Calculate the Error: Error = actual y value - predicted y value Note: If the predicted value is larger than the actual value, the error will be a negative number. This is why we square the errors - to turn them into positive numbers.

19
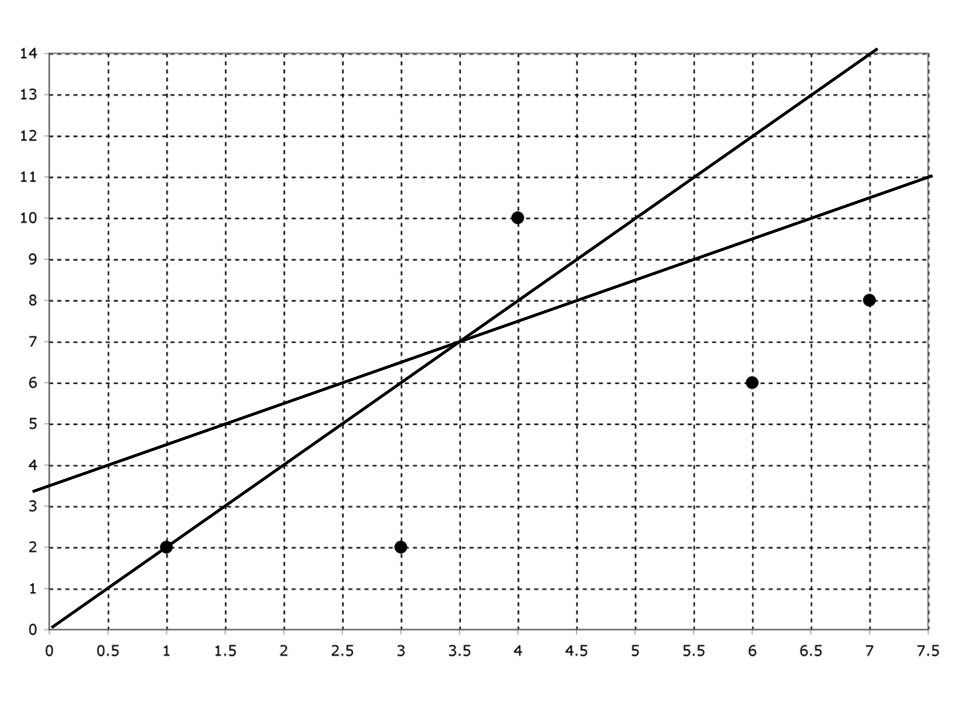
For example… XY Predicted Y values (Line A) Vertical Distances (errors) Distances Squared 377.2- 0.2.04 499.6- 0.6.036 7129.52.56.25 SUM: 6.35 XY Predicted Y values (Line B) Vertical Distances (errors) Distances Squared 377.5- 0.5.25 499.2- 0.2.04 71211.3.7.49 SUM:.78
 Vertical Distances (errors) Distances Squared SUM: 6.35 XY Predicted Y values (Line B) Vertical Distances (errors) Distances Squared SUM:.78")
Similar presentations


 + 43.721 y = 29.6195 if x = 6, y = ? y = -0.8141(6)>")


 Bani K. Mallick1 STAT 651 Lecture #18.>")


 one categorical variable and one measurement.>")

 for each data point is the ________________________.>")


