Download presentation
Presentation is loading. Please wait.

1
Managing and Curating Data Chapter 8

2
Introduction Data organization Data management Data curation Raw data is required to repeat a scientific study Any data supported by public funds is legally required to be available for other scientists and the public

3
Step 1: Managing Raw Data Various sources of data –Data loggers –Handwritten notes This data must be transferred to an organized format, checked and analyzed

4
Spreadsheets Row: single observation Column: single measured or observed variable Enter data ASAP! –Detect mistakes –Memory (doesn’t last long) –2 copies –Timely analysis Proofread the data Check it NumberBiomass Carrots1030.2 Peppers3020.6 Broccoli10450.1 2006 Garden Yield
 –2 copies –Timely analysis Proofread the data Check it NumberBiomass Carrots Peppers Broccoli Garden Yield.")
5
Metadata: Data about data “Must have” metadata: –Name and contact info of collector –Location of data collection –Name of study –Source of funding –Description of the organization of the data file Methods used to collect Types of experimental units Description of abbreviations Explicit description of data in columns and rows May be created before in some cases Very important to assemble because it’s easily forgotten

6
Step 3: Checking the Data Outliers: values of measurements or observations that are outside the range of the bulk of the data Values beyond the upper or lower deciles (the 90% or the 10%) Outliers increase the variance in data and increase the chance of a Type II error
 Outliers increase the variance in data and increase the chance of a Type II error")
8
How to deal with outliers Do not delete them; this could be considered fraud Only delete if an error or the data no longer are valid Think about them –Interesting hypotheses –A large body of science is devoted to outliers –What type of distribution does your data have?

9
Errors and Missing Data Errors are often outliers and can be identified Sources: Mistyping (decimal points), instrument, field entry Checking data can reduce errors Never leave blank cells in spreadsheets; enter a zero or NA (not available)
, instrument, field entry Checking data can reduce errors Never leave blank cells in spreadsheets; enter a zero or NA (not available)")
10
Detecting Outliers and Errors Three techniques –Calculating column statistics –Checking ranges and precision of column values –Graphical exploratory data analysis

11
Detecting Outliers and Errors cont. Column stats: –Mean, median, standard deviation, variance Logical functions to check your columns Range checking your data Carrot Id # lengthBiomass 1128 22416 326118 4105 Mean76.7511.75 Median1812 St Dev122.96.24 Variance15126.338.9 Min105 Max26118

12
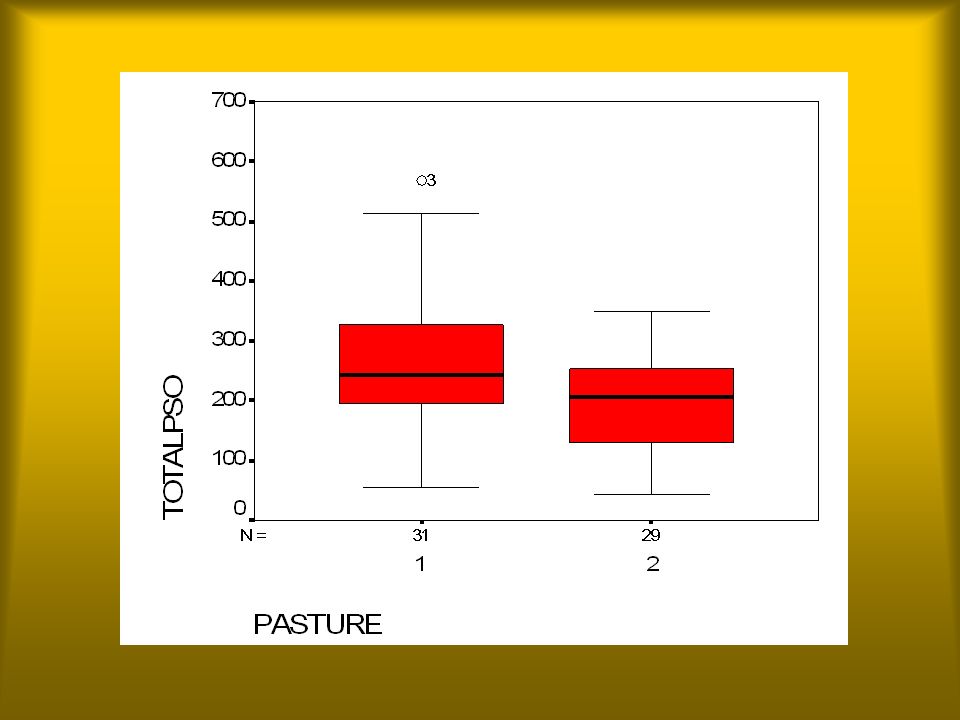
Graphical Exploratory Data Analysis Box plots (univariate) Stem-and-leaf plots (univariate) Scatterplots (bivariate or multivariate)
 Stem-and-leaf plots (univariate) Scatterplots (bivariate or multivariate)")
14
Stem-and-leaf plots Example: Vegetable biomass: 7,15, 35,36,37,23,27,21,42,55 0 7 1 5 2 1,3,7 3 5,6,7 4 2 5

15
Scatter plots Use to see how traits relate to one another

16
Creating an Audit Trail Examining data for outliers and errors is a QA/QC for research Document how you perform QA/QC in your metadata Your audit trail allows others to reanalyze and recreate your results May be required for legal documentation

Similar presentations


 13/14 Semester 1 Instructor: Rama Oktavian Office Hr.: T.12-14, Th. 12-14.>")


 Getting Started Guide.>")


 18.0 WINDOWS.>")


