Download presentation
Presentation is loading. Please wait.

1
Object Orie’d Data Analysis, Last Time Finished Q-Q Plots –Assess variability with Q-Q Envelope Plot SigClust –When is a cluster “really there”? –Statistic: 2-means Cluster Index –Gaussian null distribution –Fit to data (for HDLSS data, using invariance) –P-values by simulation –Breast Cancer Data
 –P-values by simulation –Breast Cancer Data.")
2
More on K-Means Clustering Classical Algorithm (from MacQueen,1967) Start with initial means Cluster: each data pt. to closest mean Recompute Class mean Stop when no change Demo from: http://home.dei.polimi.it/matteucc/Clustering/tutorial_html/AppletKM.html

3
More on K-Means Clustering Raw Data 2 Starting Centers

4
More on K-Means Clustering Assign Each Data Point To Nearest Center Recompute Mean Re-assign

5
More on K-Means Clustering Recompute Mean Re-Assign Data Points To Nearest Center

6
More on K-Means Clustering Recompute Mean Re-Assign Data Points To Nearest Center

7
More on K-Means Clustering Recompute Mean Final Assignment

8
More on K-Means Clustering New Example Raw Data Deliberately Strange Starting Centers

9
More on K-Means Clustering Assign Clusters To Given Means Note poor clustering

10
More on K-Means Clustering Recompute Mean Re-assign Shows Improvement

11
More on K-Means Clustering Recompute Mean Re-assign Shows Improvement Now very good

12
More on K-Means Clustering Different Example Best 2-means Cluster? Local Minima?

13
More on K-Means Clustering Assign Recompute Mean Re-assign Note poor clustering

14
More on K-Means Clustering Recompute Mean Final Assignment Stuck in Local Min

15
More on K-Means Clustering Same Data But slightly different starting points Impact???

16
More on K-Means Clustering Assign Recompute Mean Re-assign Note poor clustering

17
More on K-Means Clustering Recompute Mean Final Assignment Now get Global Min

18
More on K-Means Clustering ???Next time: Redo above, using my own Matlab calculations That way can show each step And get right answers.

19
More on K-Means Clustering Now explore starting values: Approach randomly choose 2 data points Give stable solutions? Explore for different point configurations And try 100 random choices Do 2-d examples for easy visualization

20
More on K-Means Clustering 2 Clusters: Raw Data (Normal mixture)
")
21
More on K-Means Clustering 2 Clusters: Cluster Index, based on 100 Random Starts

22
More on K-Means Clustering 2 Clusters: Chosen Clustering

23
More on K-Means Clustering 2 Clusters Results All starts end up with good answer Answer is very good (CI = 0.03) No obvious local minima
 No obvious local minima")
24
More on K-Means Clustering Stretched Gaussian: Raw Data

25
More on K-Means Clustering Stretched Gaussian : C. I., based on 100 Random Starts

26
More on K-Means Clustering Stretched Gaussian : Chosen Clustering

27
More on K-Means Clustering Stretched Gaussian Results All starts end up with same answer Answer is less good (CI = 0.35) No obvious local minima
 No obvious local minima")
28
More on K-Means Clustering Standard Gaussian: Raw Data

29
More on K-Means Clustering Standard Gaussian : C. I., based on 100 Random Starts

30
More on K-Means Clustering Standard Gaussian: Chosen Clustering

31
More on K-Means Clustering Standard Gaussian Results All starts end up with same answer Answer even less good (CI = 0.62) No obvious local minima So still stable, despite poor CI
 No obvious local minima So still stable, despite poor CI")
32
More on K-Means Clustering 4 Balanced Clusters: Raw Data (Normal mixture)
")
33
More on K-Means Clustering 4 Balanced Clusters: CI, based on 100 Random Starts

34
More on K-Means Clustering 4 Balanced Clusters 100 Random Starts Many different solutions appear I.e. there are many local minima Sorting on CI (bottom) shows how many 2 seem smaller than others What are other local minima? Understand with deeper visualization
 shows how many 2 seem smaller than others What are other local minima. Understand with deeper visualization.")
35
More on K-Means Clustering 4 Balanced Clusters: Class Assignment Image Plot

36
More on K-Means Clustering 4 Balanced Clusters: Vertically Regroup (better view?)
")
37
More on K-Means Clustering 4 Balanced Clusters: Choose cases to “flip” – color cases

38
More on K-Means Clustering 4 Balanced Clusters: Choose cases to “flip” – color cases

39
More on K-Means Clustering 4 Balanced Clusters: “flip”, shows local min clusters

40
More on K-Means Clustering 4 Balanced Clusters: sort columns, for better visualization

41
More on K-Means Clustering 4 Balanced Clusters: CI, based on 100 Random Starts

42
More on K-Means Clustering 4 Balanced Clusters: Color according to local minima

43
More on K-Means Clustering 4 Balanced Clusters: Chosen Clustering, smallest CI

44
More on K-Means Clustering 4 Balanced Clusters: Chosen Clustering, 2 nd small CI

45
More on K-Means Clustering 4 Balanced Clusters: Chosen Clustering, larger 3 rd CI

46
More on K-Means Clustering 4 Balanced Clusters: Chosen Clustering, larger 4 th CI

47
More on K-Means Clustering 4 Balanced Clusters: Chosen Clustering, larger 5 th CI

48
More on K-Means Clustering 4 Balanced Clusters: Chosen Clustering, larger 6 th CI

49
More on K-Means Clustering 4 Balanced Clusters Results Many Local Minima Two good ones appear often (2-2 splits) 4 worse ones (1-3 splits less common) 1 with single strange point Overall very unstable Raises concern over starting values
 4 worse ones (1-3 splits less common) 1 with single strange point Overall very unstable Raises concern over starting values")
50
More on K-Means Clustering 4 Unbalanced Clusters: Raw Data (try for stability)
")
51
More on K-Means Clustering 4 Unbalanced Clusters: CI, based on 100 Random Starts

52
More on K-Means Clustering 4 Unbalanced Clusters: Recolor by CI

53
More on K-Means Clustering 4 Unbalanced Clusters: Chosen Clustering, smallest CI

54
More on K-Means Clustering 4 Unbalanced Clusters: Chosen Clustering, 2 nd small CI

55
More on K-Means Clustering 4 Unbalanced Clusters: Chosen Clustering, larger 3 rd CI

56
More on K-Means Clustering 4 Unbalanced Clusters Results Fewer Local Minima (more stable) Two good ones appear often (2-2 splits) Single 1-3 split less common Previous instability caused by balance? Maybe stability OK after all?

57
More on K-Means Clustering Data on Circle: Raw Data (maximal instability?)
")
58
More on K-Means Clustering Data on Circle: CI, based on 100 Random Starts

59
More on K-Means Clustering Data on Circle: Recolor by CI

60
More on K-Means Clustering Data on Circle: Chosen Clustering, smallest CI

61
More on K-Means Clustering Data on Circle : Chosen Clustering, 2 nd small CI

62
More on K-Means Clustering Data on Circle : Chosen Clustering, 3 rd small CI

63
More on K-Means Clustering Data on Circle Results Seems many local minima Several are the same? Could be programming error? But clear this is an unstable example

64
K-Means Clustering Caution This is all a personal view Others would present different aspects E.g. replace Euclidean dist. by others E.g. other types of clustering E.g. heat-map dendogram views …

65
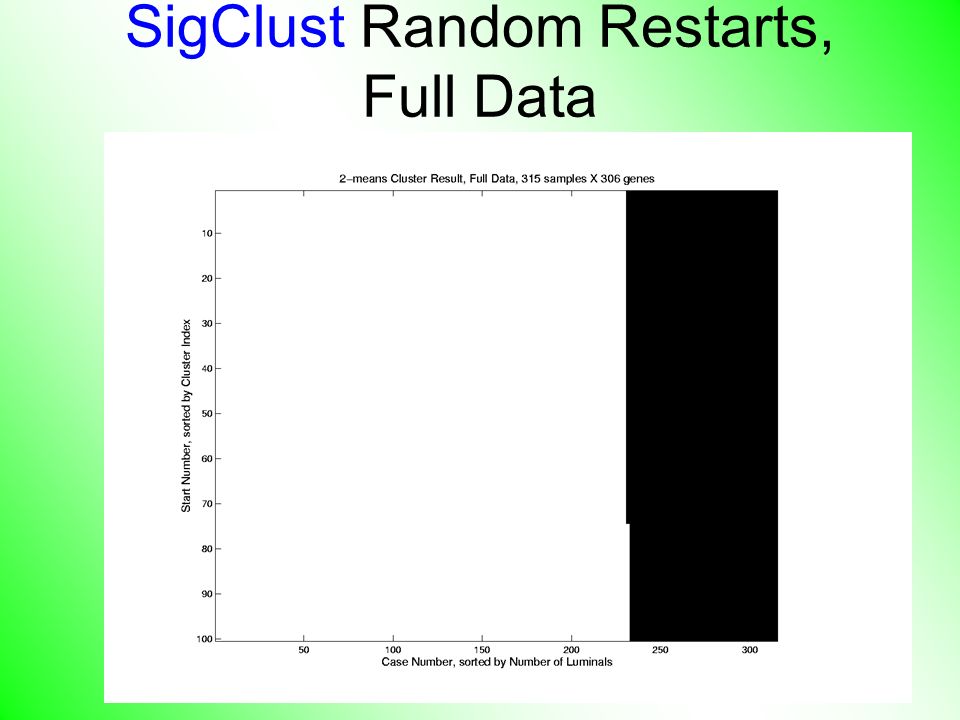
SigClust Breast Cancer Data K-means Clustering & Starting Values Try 100 random Starts For full data set: Study Final CIs Shows just two solutions Study changes in data, with image view Shows little difference between these Overall: Typical for clusters can split When Split is Clear, easily find it

66
SigClust Random Restarts, Full Data

68
SigClust Breast Cancer Data For full Chuck Class (e.g. Luminal B): Study Final CIs Shows several solutions Study changes in data, with image view Shows multiple, divergent minima Overall: Typical for “terminal” clusters When no clear split, many local optima appear Could base test on number of local optima???
: Study Final CIs Shows several solutions Study changes in data, with image view Shows multiple, divergent minima Overall: Typical for terminal clusters When no clear split, many local optima appear Could base test on number of local optima .")
69
SigClust Random Restarts, Luminal B

71
SigClust Breast Cancer Data ??? Next time: show many more of these To better build this case….

Similar presentations


 Vipin Kumar Army High Performance.>")


.>")

