Download presentation
Presentation is loading. Please wait.

1
Semester 2: Lecture 5 Quantitative Data Analysis: Bivariate Analysis 2 – Identifying Correlations using Parametric and Non-Parametric Tests Prepared by: Dr. Lloyd Waller ©

2
Bivariate Analysis 2 1.Measures of Association using Contingency Tables and Non- Parametric Tests such as Chi Square 2.Correlations using both Non-Parametric Tests as well as Parametric Tests – Spearman Rho and Pearson r/Regression Analysis respectively

3
Bivariate Analysis 2 CORRELATION Existence (is there a relationship?) Strength (How strong is the relationship?) Significance (Is there really a relationship?) Direction (What is the relationship?)
 Strength (How strong is the relationship ) Significance (Is there really a relationship ) Direction (What is the relationship )")
4
Spearman Rank Order Correlation Spearman Rho (r s ) Named after Charles E. Spearman (1863-1945) It is a test which is used to calculate the strength of the relationship between two continuous variables Assumptions: 1. Data on both variables are at least ordinal. 2. Scores on one variable are monotonically related to the other variable. This means that as the values of one variable increase, the other should also increase but not necessarily in a linear (straight line) fashion.
 It is a test which is used to calculate the strength of the relationship between two continuous variables Assumptions: 1. Data on both variables are at least ordinal. 2. Scores on one variable are monotonically related to the other variable. This means that as the values of one variable increase, the other should also increase but not necessarily in a linear (straight line) fashion..")
5
Spearman Rank Order Correlation Spearman Rho (r s ) Perfect Positive Correlation = +1 (1.00 means that the rankings are in perfect agreement) Good positive correlation = +0.8 The correlation of offence seriousness and sentence length (N = 8), and The correlation of offence seriousness and sentence length involving tied cases (N = 8) No correlation = 0.00 (0 signifies that there is no relationship) Fairly good negative correlation = -0.60 Perfect Negative Correlation = -1 (-1.00 is if they are in perfect disagreement ) Bryman, A., and Cramer, D. (2005) Quantitative Data Analysis with SPSS 12 and 13. London: Rouledge – p. 219
 Quantitative Data Analysis with SPSS 12 and 13. London: Rouledge – p")
6
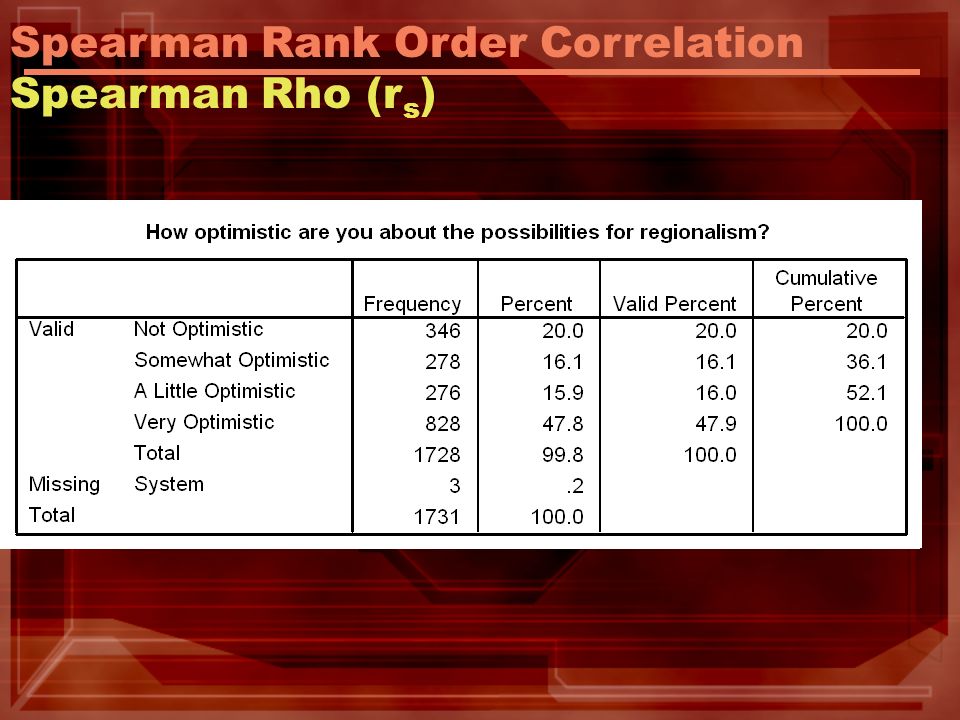
Spearman Rank Order Correlation Spearman Rho (r s ) An Example: Persons with a greater knowledge of the CSME are more likely to more optimistic view about the potential for regionalism
 An Example: Persons with a greater knowledge of the CSME are more likely to more optimistic view about the potential for regionalism")
7
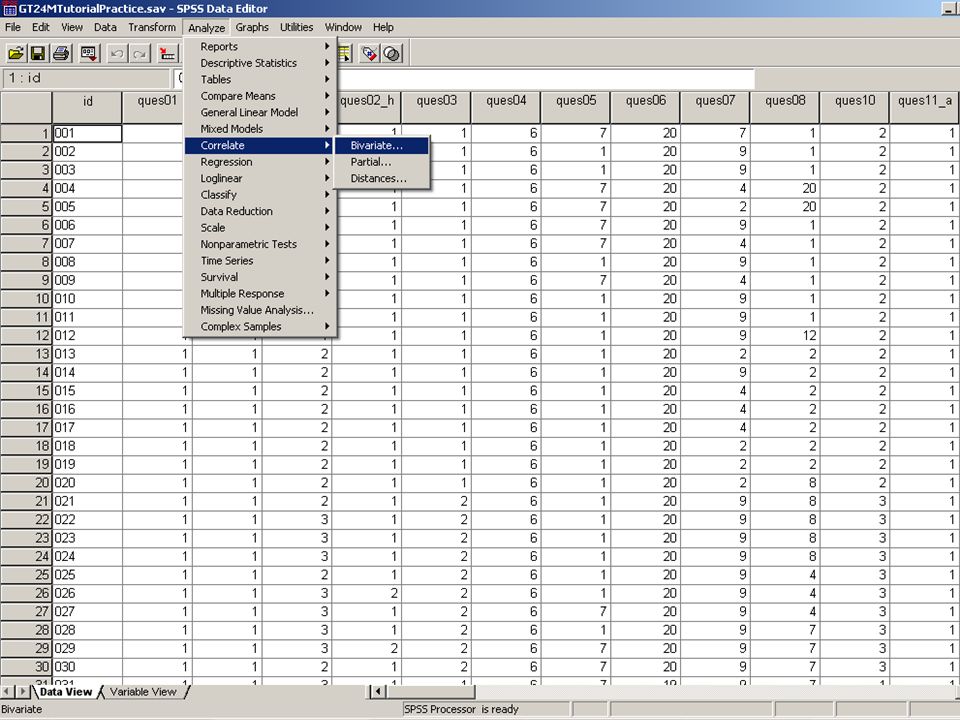
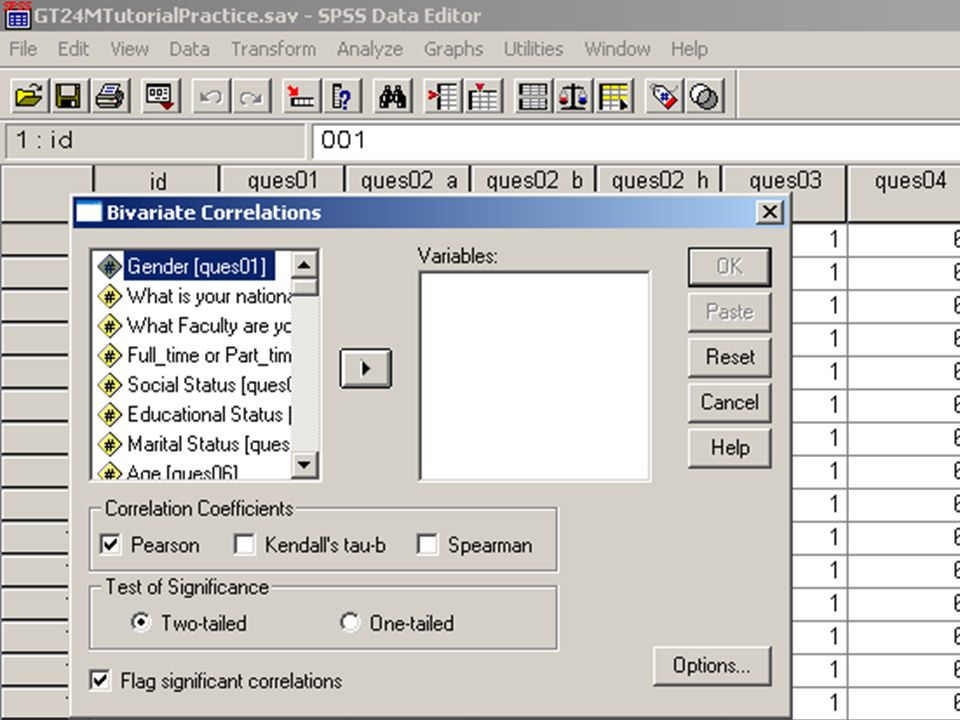
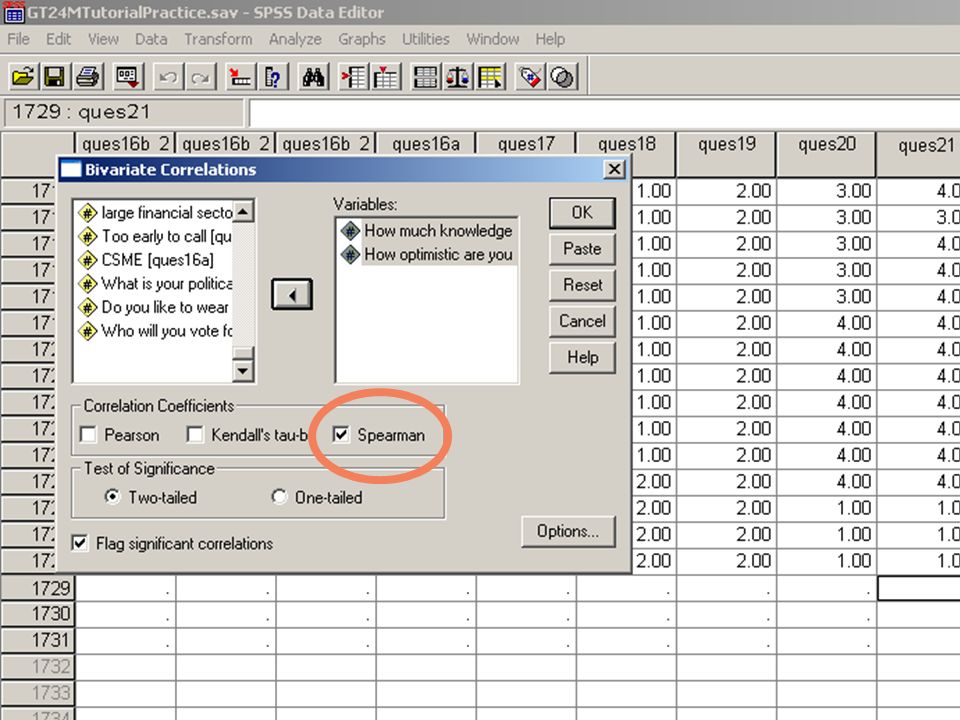
Spearman Rank Order Correlation Spearman Rho (r s )
")
13
Pearson Product Moment Correlation Pearson’s r Named after Karl Pearson (1857- 1936) Both X and Y measured at the Interval/Ratio level Most widely used coefficient in the literature when using interval level variables Correlation
 Both X and Y measured at the Interval/Ratio level Most widely used coefficient in the literature when using interval level variables Correlation")
Similar presentations