Download presentation
Presentation is loading. Please wait.

1
Issues and challenges in literacy and education for Aboriginals in Saskatchewan The Honourable Dr. Lillian Eva (Quan) Dyck, Senator Presentation to the Saskatchewan Aboriginal Literacy Network Community Outreach, October 24 and 30, 2007
 Dyck, Senator Presentation to the Saskatchewan Aboriginal Literacy Network Community Outreach, October 24 and 30,")
2
Outline How many Aboriginal people are there? What are our literacy proficiencies? What are our educational attainments? How does literacy proficiency affect educational success? What are some of the issues or challenges in literacy and education? Unless indicated otherwise, data shown in this presentation are from Statistics Canada, 2001 census

3
Statistical information The Canadian picture, Census 2001 A focus of Saskatchewan Literacy proficiency Educational attainment

4
2001 Census % of population that was Aboriginal In Canada 3% In Saskatchewan 14% In Saskatoon 9%

5
Saskatchewan and Manitoba had the highest proportion of Aboriginals amongst the provinces ****

6
Compared to the rest of the Canadian population, the Aboriginal population is relatively young and increasing more rapidly.

7
The Brown Baby Boom vs The Aging Baby Boomers

8
In SASK, about 60% of Aboriginals off-reserve were under 25 yrs old, compared to about 30% for the non-Aboriginal population. * *

9
The Importance of Literacy: “Literacy really matters in every country for social, cultural, political and economic reasons. Countries that ignore the imperatives of developing literacy skills to the highest possible levels do so at their peril.” From: Canadian Council on Learning Report: “State of Learning in Canada –No Time for Complacency” January 26, 2007

10
Literacy proficiency is the daily ability to understand and to use printed information at home, at work and in the community. Level 3 - of 5 levels - is considered to be the minimum requirement for a given individual to function adequately in our current modern, knowledge-based economy. A given population should have at least an average literacy score of level 3 in the domains assessed: prose, numeracy, document and problem solving. If the average score is less than level 3, the skill level of the population is not sufficient for satisfactory job performance and everyday functioning.

11
Description of the Levels Level 1: having difficulty or not being able to read. Level 2: being able to find familiar words in simple texts. Level 3: being able to read well enough to cope with everyday reading tasks, and to complete high school requirements. Levels 4/5: being able to complete higher order information processing.

12
A Wake-up Call

13
% of the population with less than level 3 literacy proficiency (ages 16-65 Prose literacyNumeracy literacy Canada48% (about 9 million people) 55% SK33% (about 200,000 people) 42% (about 250,000 people) (only about 7,000 adults in SK are being helped by literacy programs)
 55% SK33% (about 200,000 people) 42% (about 250,000 people) (only about 7,000 adults in SK are being helped by literacy programs)")
14
Proportionally more urban Aboriginals than non-Aboriginals in SASK have less than level 3 prose proficiency (ages 16-65) % Aboriginal67% (about 22,000 Aboriginals) Non-Aboriginal40% (about 180,000 non-Aboriginals)
 % Aboriginal67% (about 22,000 Aboriginals) Non-Aboriginal40% (about 180,000 non-Aboriginals)")
15
% of young adults (aged 16-25) with less than level 3 literacy proficiencies Canada45% SK39-40% (about 56,000 young adults) Nunavut80% All other provs38-45%
 with less than level 3 literacy proficiencies Canada45% SK39-40% (about 56,000 young adults) Nunavut80% All other provs38-45%")
16
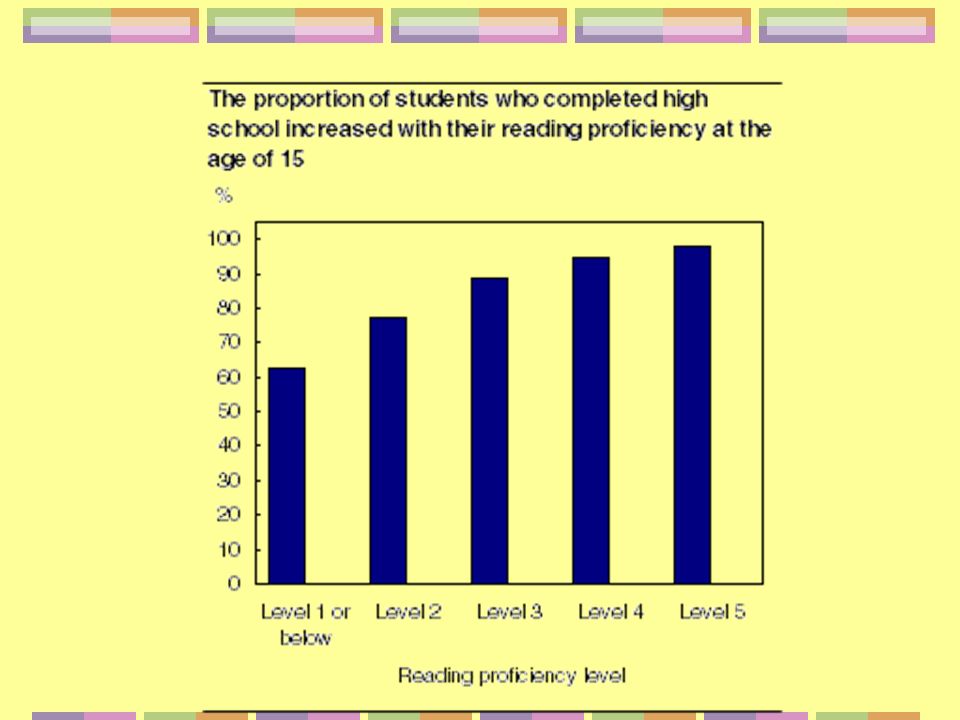
Literacy proficiency affects success in high school Young people who had dropped out of high school by age 19 had lower reading scores at age15. The proportion of youth who finished high school by age 19 rose with reading proficiency.

18
My Literacy & Numeracy Skill Development Regal Café, Killam, AB

19
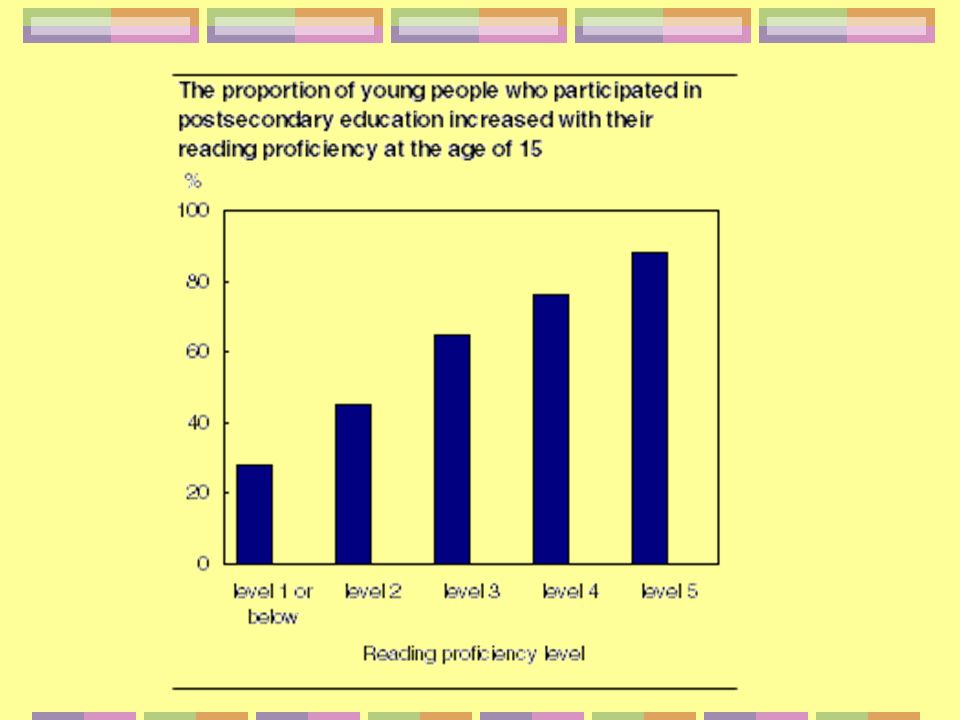
Reading proficiency is related to pursuit of postsecondary education Proficiency in reading at age 15 was related to the pursuit of postsecondary education by age 19.

21
Higher levels of literacy proficiency are associated with higher levels of education Prose literacy levels by educational attainment, ages 26-65 years, Canada, 2003 Source: IALSS, 2003

22
Aboriginals lag behind the non-Aboriginal population at all levels of education in SK % of Aboriginals % of Non- Aboriginals Less than H. Sc.53%38% Trades cert/diploma 11%13% Bachelor’s degree 4%9% (Ages 15 and over)
.")
23
If all things were equal, 4000 more Aboriginal people would have had a Bachelor’s degree in Saskatchewan in 2001.

24
Women had higher levels of education than men, except for the Trades, in Saskatchewan in 2001 (Ages 15 and over) % of female Aboriginals % of male Aboriginals % of Female Non-Abor’s % of male Non-Abor’s < H. Sc47%56%36%40% Trades9%14%10%16% Bachelor’s5%3%12%9%

25
If the sexes were equal, 937 more Aboriginal men in SK in 2001 would have had a bachelor’s degree.

26
Why are the literacy proficiencies and educational attainments of Aboriginals less than the rest of our population? What can be done to close the gaps?

27
Uneven educational opportunities Urban vs Rural or remote schools On reserve vs off reserve schooling Parenting-childcare issues Funding issues “Churn” – mobility of Aboriginal families.

28
Socioeconomic issues Poverty FAE, FAS, learning abilities Family issues – childcare, fostercare, single parenthood Loss of identity, language, culture Racism, discrimination Difficulty accessing services (funding, awareness of what is available, etc)
")
29
What can be done to close the gaps Restore or increase funding to programs that allow adults to increase their literacy skills or increase their educational level. Increase the percentage of Aboriginals who complete high school. and who complete postsecondary education. Increase funding to individuals to allow them to attend PS institutions.

30
Wake-up call Reminder the Brown Baby Boom: By 2017, 21% of the population in SASK will be Aboriginal. By 2045, 50% of the SASK population will be Aboriginal.

31
Key Messages Aboriginals lag behind mainstreamers in literacy skills. This decreases the likelihood of completing high school and PSE. Aboriginals lag behind mainstreamers at all levels of education. Aboriginal men lag behind Aboriginal women in education. The Brown Baby Boom calls for action. Action requires sustained support and specific literacy tools ($$$$ over many years).
..")
33
Educational Gaps identified for First Nations people It will take 26 yrs for First Nations to catch up to non-Aboriginals. 70% of First Nations students on reserve will not complete high school. 10,000 FN students are waiting for funding. 27% of FN students (age 15-44) compared to 46% of Canadian students hold a post-secondary certificate, diploma or degree.
 compared to 46% of Canadian students hold a post-secondary certificate, diploma or degree..")
34
Major references International Adult Literacy and Skills survey (IALS), 2003. State of Learning in Canada: No Time for Complacency, Canadian Council on Learning, January 26, 2007. Aboriginal Peoples Survey 2001 – Provincial and Territoritorial Reports: Off reserve Aboriginal Population, Statistics Canada. Aboriginal peoples in Canada’s urban area – Narrowing the education gap, Education Matters 2005, Statistics Canada. The Daily, June 7, 2006, Study: Relationship between reading literacy and education outcomes. Stats Canada. Provincial Drop-out rates – Trends and consequences, Stats Canada. Aboriginal Peoples living off reserve in Western Canada, Stats Canada. Aboriginal Peoples and postsecondary education in Canada, Mendelson M, Caledon Institute of Social Policy Research, 2006. Urban Aboriginal Youth: An action plan for change, Standing Senate committee on Aboriginal Affairs, 2003. Assembly of First Nations Briefing Package, April 2006.

35
The unemployment rate for off reserve Aboriginal youth was double that of non-Aboriginal youth, 15-24 yrs of age

36
Note: 2004-05 data shown. Completing PSE equalizes the employment of off reserve Aboriginals to that of non-Aboriginals.

37
% of Canadian youth aged 20-24 with various levels of education % of Aboriginal youth % of Non- Aboriginal youth Less than H. Sc.43%16% H. Sc. Grad only 16%15% Post-Secondary Non-Univ 17%28% Bachelor’s degree 2%11%

38
Math and science literacy Data unknown ???? low % in PS science related programs, especially compared to social work, education and health programs. Programs are being developed across Canada to increase interest and provide hands-on SET experience. Math and science skills are needed for the trades and technical training, as well as for professional programs, such as engineering.

Similar presentations


>")


