Download presentation
Presentation is loading. Please wait.

1
Exponential Function

2
y = a x If we look at the graphs of y = a x for different values of a, we can see that the gradient of the exponential graph increases as the value of a increases a gradient

3
y = a x a increasing

4
Gradient of y = 2 x at (0,1) is 0.693 Gradient of y = 3 x at (0,1) is 1.099 So there must be a value (between 2 and 3) where the gradient at (0,1) is exactly 1 This number is 2.71828… and is called e
 is Gradient of y = 3 x at (0,1) is So there must be a value (between 2 and 3) where the gradient at (0,1) is exactly 1 This number is … and is called e")
5
Natural Logarithms

6
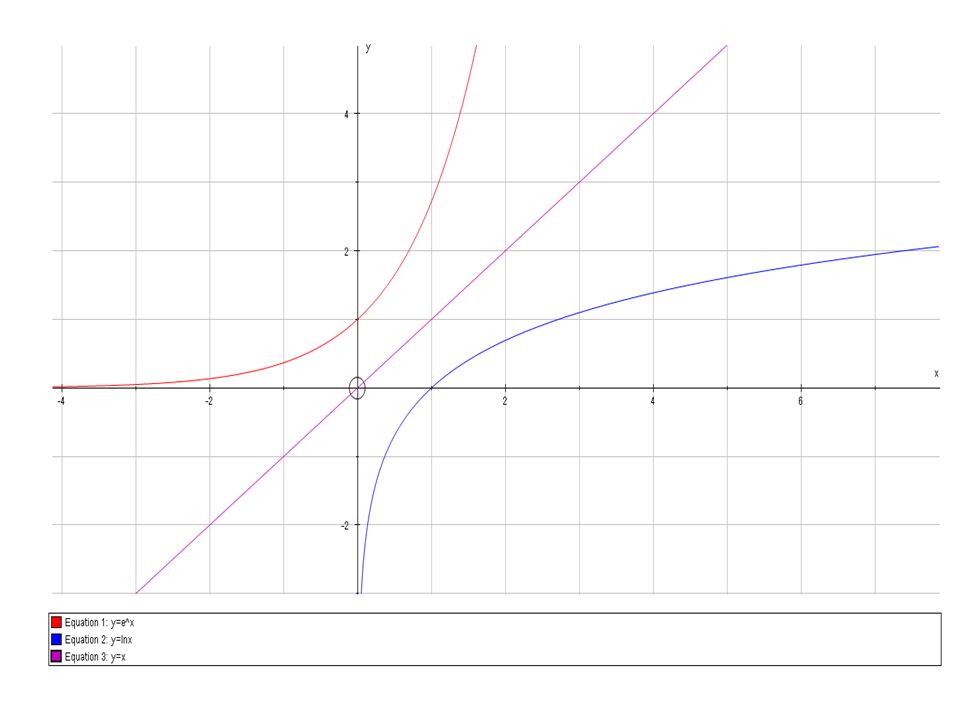
By drawing the graph of y = e x we can see that there is an inverse function

8
If y = e x Take logs of both sides log e y = log e e x log e y = xlog e e but log e e = 1 So x = log e y Interchanging x and y gives y = log e x (written as y = lnx) This is the inverse function
 This is the inverse function")
9
Questions 1. Make x the subject of lnx – lnA = kt 2. Make t the subject of s = e -kt 3. Make x the subject of y-5 = (A - 5)e x
e x.")
10
Questions 4.A colony of human settler on a previously uninhabited planet. After t years, their population, P, is given by P = 100e 0.056t a. Sketch the graph of P against t b. How many settlers were there planet initially? c. How long does it take for the population to reach 1 million?

11
Answers 1.lnx – lnA = kt ln(x/A) = kt x/A = e kt x = Ae kt 2.s = e -kt lns =-kt t =-lns/k 3. y-5 = (A - 5)e x e x =(y-5)/(A - 5) x =ln((y-5)/(A - 5))
e x e x =(y-5)/(A - 5) x =ln((y-5)/(A - 5)).")
12
Answers ctd 4.P = 100e 0.056t b.When t= 0P = 100e 0 = 100 c. P = 100e 0.056t = 1,000,000 e 0.056t = 10,000 0.056t = ln 10,000= 9.2103 t = 9.2103/0.056 = 164.47.47 years =12x.47 months = 5.64months It takes 164.5 years to 4 s.f. or 164 years 6 months to the nearest month

Similar presentations

 and Natural Logarithms (lnx) Exponential function e x.>")

 Tell whether each function represents growth or decay, then graph by using a table of values: 1.>")


 log e x or ln x.>")


,>")


