Download presentation
Presentation is loading. Please wait.

1
World Relief’s CS Health Information System CCIH M&E Workshop May 28, 2005 Melanie Morrow World Relief

2
Presentation Overview of World Relief’s Vurhonga CSP in Mozambique Key components of the Vurhonga HIS –Regular surveys to monitor progress –Community HIS Tracking mortality

3
WR Vurhonga “Dawn” CSPs Vurhonga 1 1995-1999 –Guija & Mabalane Districts –107,000 population Vurhonga 2 1999-2003 –Chokwe District –2350 Volunteers trained in 173 Care Groups –130,000 (140,000 EOP) pop –C-IMCI + HIV + BS Expanded Impact 2004-09 –5 New Districts in Gaza Province –C-IMCI + HIV
 pop –C-IMCI + HIV + BS Expanded Impact –5 New Districts in Gaza Province –C-IMCI + HIV")
4
Major Program Components Educating and mobilizing the community to prevent illness and seek appropriate treatment Creating and training VHCs to address health issues at village level Increasing access to care at village level

5
Vurhonga 2 Care Group Structure 5 Supervisors 26 Animators Care Groups of 10-15 Volunteers 10 HH per volunteer

6
Reach: Every HH One trainer can train & supervise 8 care groups, each with 8-10 volunteers. Each volunteer is responsible for the 10-15 households on her block. In Vurhonga 2: 26 trainers reached 24,500 HH via 2350 volunteers trained in 173 Care Groups

7
Care Group Meetings Volunteers verbally report and discuss statistics from the C-HIS Problem solve as a group Between meetings, Volunteers conduct home visits for the 10-15 HH in their “block” Animator trains volunteers in interventions using pictures, stories, songs and drama

8
Home visit Volunteers greet family and inquire about their wellbeing Address current health concerns in HH Teach health lesson learned during most recent care group mtg. Make mental note of births, deaths or pregnancies

9
Other Care Groups Churches: Care Groups for pastors to teach BCC they share with their congregations. Grannies: Care Groups for grannies ensure support of elders.

10
Village Health Committees Membership includes: –Chef de Saude –Village leader –Health Post Socorrista –Care Group leader –Neighborhood reps (max 5) –Church leader –Member of OMM (women’s organization)
 –Church leader –Member of OMM (women’s organization)")
11
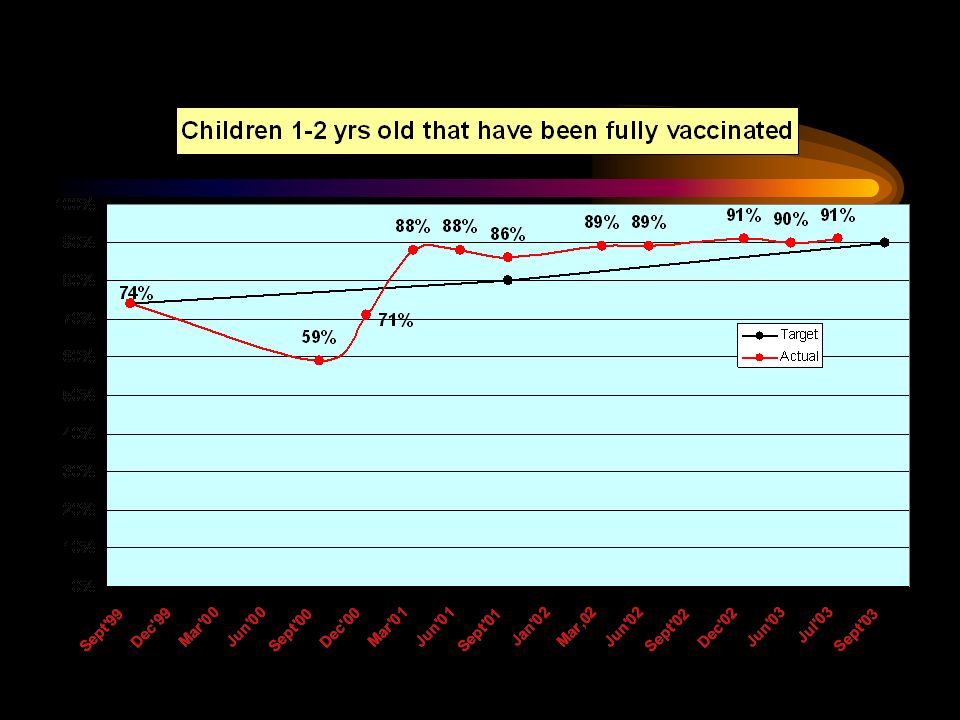
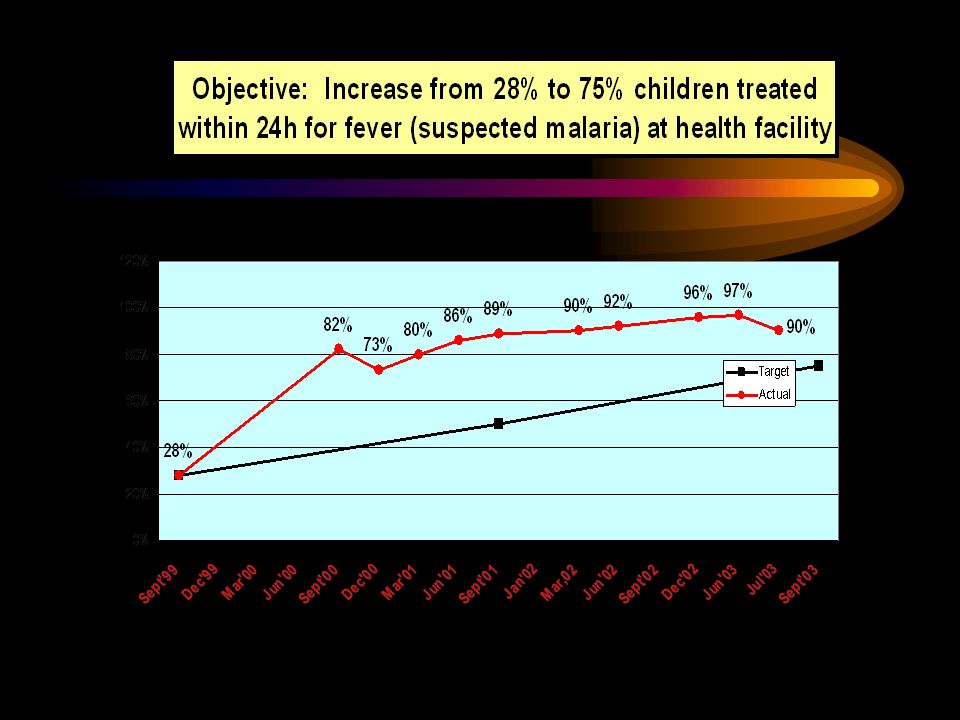
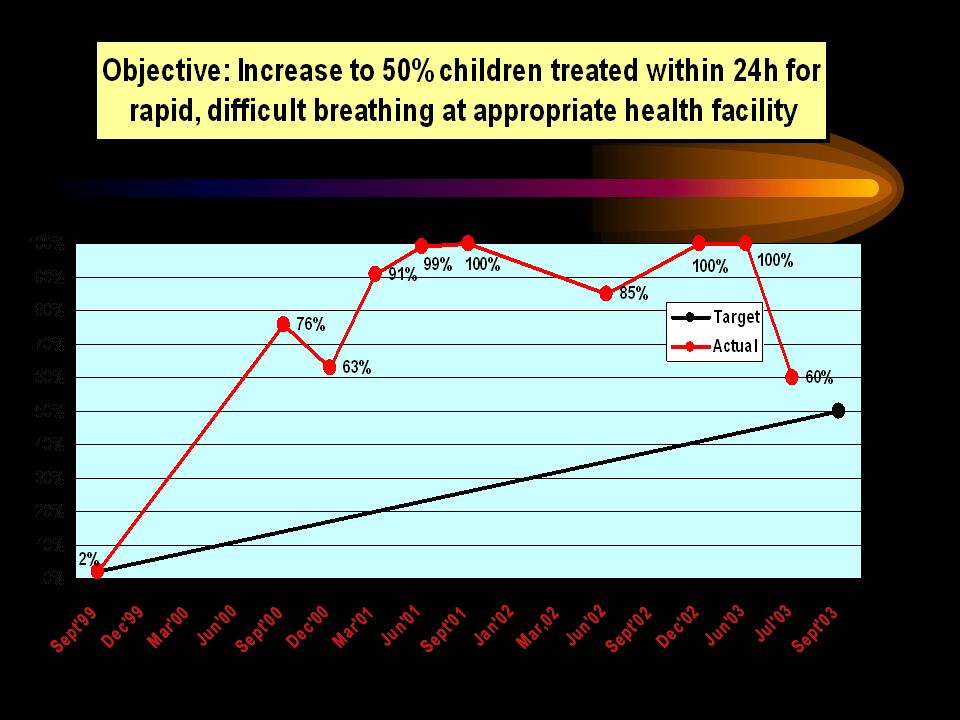
Vurhonga HMIS Components Full count of beneficiaries at baseline and repeated as needed (can include retrospective birth and mortality questions) Baseline and Final KPC Survey Monitoring surveys to track progress towards project objectives (every 3-6 months) Community-HIS (monthly Care Group statistics) for monitoring vital events
 Baseline and Final KPC Survey Monitoring surveys to track progress towards project objectives (every 3-6 months) Community-HIS (monthly Care Group statistics) for monitoring vital events")
12
Monitoring Surveys Abbreviated version of KPC instrument Similar to LQAS in that the sample is based on supervision areas; Random selection of 1 Care Group per animator Staff trade supervision areas and interview all HH with children <2 pertaining to that CG (sub sample OK) Track progress towards objectives
 Track progress towards objectives")
13
Monitoring Survey Form

19
Data use Revise strategies as appropriate (e.g. message re: mosquito nets; new pictures for reproductive health) Track performance by staff supervision areas, by individual villages & by district Share with care groups, VHCs and MOH to motivate and engage in problem solving Identify and respond to problems early
 Track performance by staff supervision areas, by individual villages & by district Share with care groups, VHCs and MOH to motivate and engage in problem solving Identify and respond to problems early.")
20
C-HIS (Monthly Care Group Stats) Care groups form the basis for a sustainable community-HIS. Volunteers verbally report on vital events (births, deaths, pregnancies) that they discuss in their meetings. The information is shared with the community and MOH without dependence on project staff. Village Health Committees (VHCs) and the MOH make decisions using these data. Volunteers are motivated by the measurable impact they are having.
 that they discuss in their meetings. The information is shared with the community and MOH without dependence on project staff. Village Health Committees (VHCs) and the MOH make decisions using these data. Volunteers are motivated by the measurable impact they are having..")
21
Care Group Statistics Volunteers verbally report vital events (births, deaths, pregnancies) for their block Mortalities are reported with the following information: Name, sex, age at death, date of illness onset, signs of illness, date of death. Literate volunteer records data

22
C-HIS (cont.) Discussion of illness signs during meeting used to determine most likely cause of death. “Questions of the month” can be added Bi-directional learning with Animator Summary data given to Vurhonga Animator and to village Socorrista Project staff together discuss monthly results and implications during regular meetings, and take action.

23
Information Flow. CSP Care Group MOH VHC Animator Socorrista

24
Sustainability of Info Flow. Care Group MOH VHC Socorrista

25
Vurhonga I volunteer retention 20 months post project Vols active at end of project: 1457 Vols who left post/moved: (92) Vols who died: (44) Replacement volunteers: 40 TOTAL No.VOLS STILL ACTIVE: 1361or 93% –Attrition 6.59% 50% of HH were visited by their volunteer in two weeks before survey
 Vols who died: (44) Replacement volunteers: 40 TOTAL No.VOLS STILL ACTIVE: 1361or 93% –Attrition 6.59% 50% of HH were visited by their volunteer in two weeks before survey")
26
Time Cost of C-HIS Tabulation 30 minutes during CG meeting once/month 15 minutes for socorrista to compile village-wide data 30 minutes for district-wide tabulation at District Hospital

27
VHCs and CGs take action VHCs of 25 de Septembro and other villages noted increase in malnourished children in early 2002. Initiated Hearth community nutrition rehabilitation sessions using Care Group volunteers. Underweight children decreased from 13% in March 2002 to 7.2% in July despite food shortages.

28
Community goal setting Mapapa VHC noted that 19 HH lacked latrines; Set goal for all HH to have latrines within 3 months. 25 de Septembro VHC helped pass a local law requiring any HH that didn’t build a latrine to pay for the labor of others sent by VHC to do it for them.

29
Community-based accountability Muzumia village VHC noted pregnant women not using hygienic delivery huts assisted by TBA Data prompted community investigation Found TBA was demanding unauthorized payment Involved MOH to resolve issue

30
MOH preparedness Increases in diarrhea cases helped the MOH in Chokwe district to anticipate and stave off a cholera epidemic that other districts were unprepared for. Community has louder voice when backed by data

31
Benefits of community-specific data Local data used at local level prompted communities to: –Tackle malnutrition –Identify underlying problems –Involve district MOH in relevant matter –Set goals –Pass local laws –And appreciate impact of volunteers

32
Project benefits of regular HMIS feedback Keep project in touch with community Motivate staff—can see impact –Results graphed on office wall Identify and respond to problems –Personnel –Intervention/communication strategy Justify continued funding

33
Ingredients for Success Analysis and application of data by those involved in collecting it Only collect what actually use Link to lasting community structures (CGs and VHCs) Sustained volunteer participation (<2% drop out per year)
 Sustained volunteer participation (<2% drop out per year)")
34
Volunteer Incentives Examples of tangible incentives –Year one: head scarf – Year two: kapulana traditional skirt – Year three: project T-Shirt Intangible incentives – Communication of respect and appreciation – Social support – Community recognition

35
End Result As a result of CGs and VHCs using the C- HIS, the community has an effective system for monitoring and governing its own health—as well as interfacing with district MOH authorities.

36
2003

37
FutureGenerations Reasons to measure mortality rates and changes in a CS project

38
Measurement of Mortality Rates and Causes of Mortality An Essential Tool for Maximizing Program Effectiveness? A CORE Function in Child Survival Programs?

39
The Initial Three-Tiered Approach to Monitoring and Evaluation Tier One: Counting the number of services provided Tier Two: Measuring coverage in the project population Tier Three: Measuring mortality impact

40
Arguments FOR Monitoring Mortality Is THE key indicator Can guide programming/increase program effectiveness Motivates staff Guides program policy formulation

41
Arguments AGAINST Monitoring Mortality Is too complicated, too time consuming, and takes high-level expertise, and must be carried out by outsiders Requires a “control” population Is too expensive Takes too many years to achieve impact Takes a very large population in order to document significant impact

42
“Gold Standard” for Demonstrating Mortality Impact Have an intervention and comparison area Show that mortality rates in these two areas were similar before the intervention Show that the mortality decreased significantly more in the intervention area than in the control area Demonstrate that the mortality reduction should be attributed to the intervention

43
Disseminating results Village chief and health committee are regularly informed of deaths and involved in discussion to learn from event. Trends are shared less often, at most every 6 months. Data are aggregated by project staff and (in Mozambique) by MOH, to promote sustainability.
 by MOH, to promote sustainability..")
44
C-HIS Information Flow from Care Groups CSP Care Group MOH VHC Animator Socorrista

45
Sustainability of data flow from Care Groups to Village Health Committees & District MOH Care Group MOH VHC Socorrista

46
Moz: U5 cause specific mortality

47
Cambodia: % of deaths attributable to EPI

48
Calculating mortality rates Infant Mortality Rate: # deaths children 0-11 mo/1000 live births Child Mortality Rate: # deaths in children age 12-59m/1000 live births Under five mortality rate: # deaths in children U5/1000 live births Counts also useful if don’t know # births

49
Problems with Prospective Tracking Under-reporting of births—need to use a pregnancy register to catch all births Sensitivity needed to discern when culturally appropriate to visit family without waiting too long so that people forget important details. Hard to independently verify if all deaths have been captured.

50
Retrospective tracking of Mortalities in Mozambique Midterm count of all beneficiaries included inquiry about all births and deaths during preceding two years. Possible underreporting because –respondents inclined to leave out events that occurred on the “border” of time asked about (though bounded by flood) –Less likely to include more distant events
 –Less likely to include more distant events.")
51
Mortality Data from Census/HIS

52
Retrospective tracking using pregnancy history At final eval, sample of 250 women interviewed about all pregnancies they have had during their lifetime and their outcomes. Intervals spanning 3 or more years without a birth were probed for possible miscarriages or unreported mortalities

53
Mortality Data from Pregnancy Histories

54
Comparison of Census vs. Pregnancy History **Pregnancy History data for 2000 includes flood deaths

55
Pregnancy History (cont) Pro: get complete history, has been validated in literature for accurate mortality estimates going back ~10 yrs.
 Pro: get complete history, has been validated in literature for accurate mortality estimates going back ~10 yrs.")
56
Problems with Retrospective Studies Recall bias leading to under-reporting If don’t use own staff, population reluctant to talk about deaths; if use own staff scientific community reluctant to believe results Making lists is sometimes considered a suspect (politically destabilizing) activity Cultural definitions of child deaths (e.g. baby not considered a person until reaches a certain milestone or named)
.")
57
Problems with Retrospective Studies (cont.) Determining adequate sample size for retrospective pregnancy history can be difficult Sample size can be quite large High maternal mortality rates could skew results Many confounders
 Determining adequate sample size for retrospective pregnancy history can be difficult Sample size can be quite large High maternal mortality rates could skew results Many confounders")
58
Staff and Volunteers in Mapapa Village

59
Project Action Quarterly survey results showed children's ITN use changed as follows –Sept 1999 0% –April 200193% –Aug 200168% Refocused BCC to promote ITN use even in “winter” months –July 200281%

60
Key Ingredients for Success Analysis and application of data by those involved in collecting it Only collect what actually use Link to lasting community structures (VHCs) Sustained Volunteer Participation
 Sustained Volunteer Participation")
61
Vurhonga I volunteer retention 20 months post project Vols active at end of project: 1457 Vols who left post/moved: (92) Vols who died: (44) Replacement volunteers: 40 TOTAL VOLS STILL ACTIVE: 1361 –Attrition 6.59% 50% of HH visited by volunteer in preceding two weeks
 Vols who died: (44) Replacement volunteers: 40 TOTAL VOLS STILL ACTIVE: 1361 –Attrition 6.59% 50% of HH visited by volunteer in preceding two weeks")
62
Volunteer Attrition in other WR CSPs 13.2% in Cambodia at end of year three (excluding deaths and relocation) –Lack of community identity 10% in Malawi at end of year one –Both men and women as volunteers –Association with established health institution led to expectation of employment
 –Lack of community identity 10% in Malawi at end of year one –Both men and women as volunteers –Association with established health institution led to expectation of employment")
63
Volunteer Motivation for Vurhonga Examples of tangible incentives –Year one: head scarf – Year two: skirt – Year three: project T-Shirt Intangible incentives – Communication of respect and appreciation – Social support – Community recognition

64
Benefits Accountability Contact with community Consensus-building Strengthening of partnerships Empowering communities to take responsibility for their health

Similar presentations


 A Two-fold approach DSLT 16 th November 2010 Updated with new SWRB standards.>")


