Download presentation
Presentation is loading. Please wait.

1
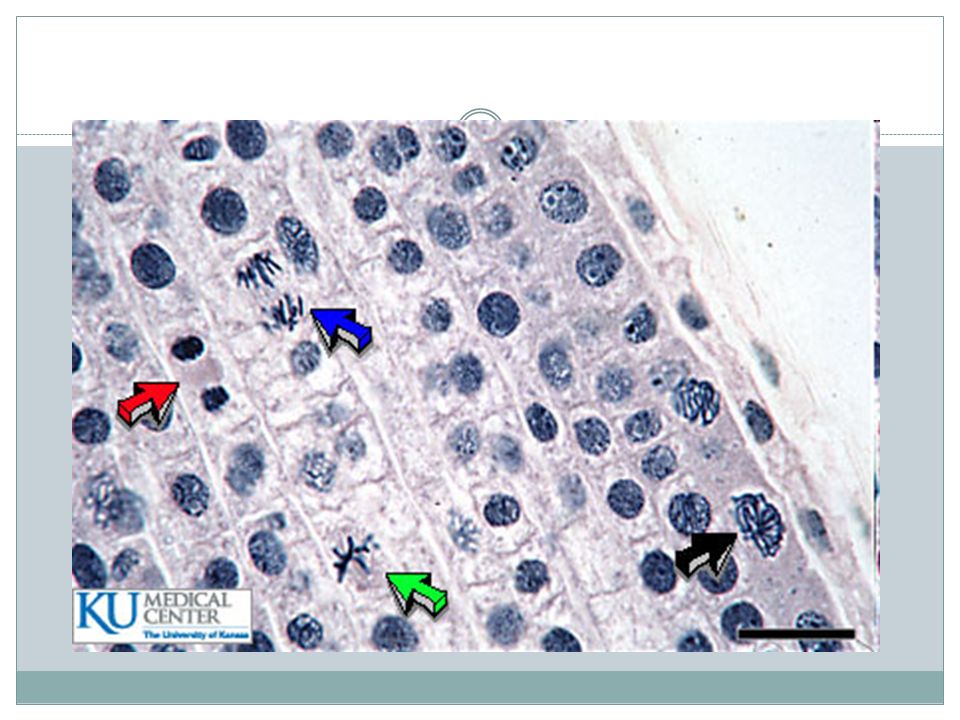
Cell Cycle Lab Examining Mitosis in the root tip of Allium Already prepared on microscope slides Objective to observe and identify Interphase, Prophase, Metaphase, Anaphase, and Telophase

2
Mitosis Phases

3
Lab Groups of 2 1 microscope per group 1 microscope slide per group View slide at 40X Count 100 cells One group member will observe and one will mark done observations for 50 cells. Then switch and observe remaining 50 cells on a different part of the slide.

6
1 interphase 2 interphase 3 early prophase 4 mid prophase 5 late prophase 6 metaphase 7 early anaphase 8 anaphase 9 early telophase 10 telophase

7
Microscope Usage Handle microscope with 2 hands One hand on the base and one hand holding arm of scope Focus at 4X first Only time you use course focus (large knob) Then focus at 10X using fine focus (small knob) Switch to 40X and focus using fine focus
 Then focus at 10X using fine focus (small knob) Switch to 40X and focus using fine focus")
8
Lab Make table of your small group’s observations: Pool class data into table Fill in excel document in class Observer (Group) Interp hase Prop hase Meta phas e Anap hase Telo phas e To tal Group 1 0 Group 2 0 Group 3 0 Group 4 0 Group 5 0 Group 6 0 TOTAL000000
 Interp hase Prop hase Meta phas e Anap hase Telo phas e To tal Group 1 0 Group 2 0 Group 3 0 Group 4 0 Group 5 0 Group 6 0 TOTAL000000")
9
Lab Report Introduction: Background about cell cycle What are the stages and what is happening in each stage Hypothesis Relative amount of time spent in each stage

10
Lab Report Methods: Prepared slides Count cells/ determine stage Discuss calculations

11
Lab Report Results: Include table of class data for each phase Calculate mean, S.D., and S.E. of CLASS DATA for each phase Generate table of small group results

12
Lab Report Calculate amount of time cells spent in each stage of mitosis. Example: Calculate percentage of time spent in a specific stage from class data Interphase: 756/1200 X 100 = 63% Use percentage to calculate time spent in stage 16 hours (time it takes to complete cell cycle) x 0.63 = 10.08 hours 0.08 hours x 60 minutes/1 hour = 4.8 minutes 0.8 minutes x 60 seconds/1 minute = 48 seconds Answer = 10 hours 4 mins 48 seconds in interphase
 x 0.63 = hours 0.08 hours x 60 minutes/1 hour = 4.8 minutes 0.8 minutes x 60 seconds/1 minute = 48 seconds Answer = 10 hours 4 mins 48 seconds in interphase.")
13
Lab Report Calculate variability measurement Used to measure variability of class in determination of stages Higher number indicates more variability Use class data to calculate variability Calculate for each stage Variability = S.E./Mean

14
Lab Report Results Make pie chart of the percentage of time spent in each stage Use class data for chart

15
Lab Report Discussion Meaning of lab Why might certain phases take longer, etc. Importance of cell cycle

16
Lab Report Conclusion Hypothesis supported? Why/ why not

17
Lab Report Introduction ___ Describe cell cycle ___ Discuss cell cycle Methods ___ Counting ___ What the numbers tell us Results ___ Class Data and Calculations (1.5 pts) ___ Individual Data (0.5 pt) ___ Pie Chart ___ Conversion from percent to time Discussion ___ Discuss meaning of the lab Conclusion ___ Hypotheses
 ___ Individual Data (0.5 pt) ___ Pie Chart ___ Conversion from percent to time Discussion ___ Discuss meaning of the lab Conclusion ___ Hypotheses")
Similar presentations


 1. Organize the cell phases in the correct order of mitosis. HOMEWORK: 1. Review material.>")


