Download presentation
Presentation is loading. Please wait.

1
Core Methods in Educational Data Mining HUDK4050 Fall 2014

2
Welcome Welcome back to the 2 nd class session

3
Administrative Stuff Is everyone signed up for class? If not, and you want to receive credit, please talk to me after class

4
Other administrative questions?

5
Continuing from first class

6
Data Used to Be Dispersed Hard to Collect Small-Scale Collecting sizable amounts of data required heroic efforts

7
Tycho Brahe Spent 24 years observing the sky from a custom-built castle on the island of Hven

8
Johannes Kepler Had to take a job with Brahe to get Brahe’s data

9
Johannes Kepler Had to take a job with Brahe to get Brahe’s data Only got unrestricted access to data…

10
Johannes Kepler Had to take a job with Brahe to get Brahe’s data Only got unrestricted access to data… when Brahe died

11
Johannes Kepler Had to take a job with Brahe to get Brahe’s data Only got unrestricted access to data… when Brahe died and Kepler stole the data and fled to Germany

12
Alex Bowers Teachers College, Columbia University “For my dissertation I wanted to collect all of the data for all of the assessments (tests and grades and discipline reports, and attendance, etc.) for all of the students in entire cohorts from a school district for all grade levels, K-12. To get the data, the schools had it as the students' "permanent record", stored in the vault of the high school next to the boiler, ignored and unused. The districts would set me up in the nurse's office with my laptop and I'd trudge up and down the stairs into the basement to pull 3-5 files at a time and I'd hand enter the data into SPSS. Eventually I got fast enough to do about 10 a day, max.”

13
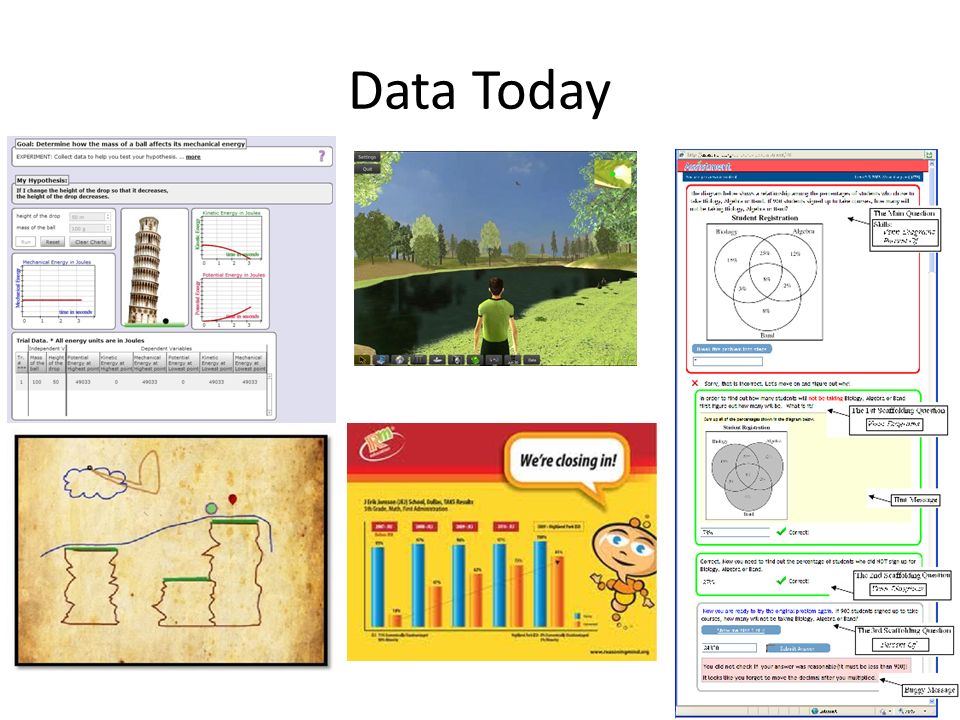
Data Today

14
14

15
Data Today 15

16
Data Today

18
*000:22:297 READY. *000:25:875 APPLY-ACTION WINDOW; LISP-TRANSLATOR::AUTHORINGTOOL-TRANSLATOR, CONTEXT; 3FACTOR-CROSS-XPL-4, SELECTIONS; (GROUP3_CLASS_UNDER_XPL), ACTION; UPDATECOMBOBOX, INPUT; "Two crossover events are very rare.",. *000:25:890 GOOD-PATH. *000:25:890 HISTORY P-1; (COMBOBOX-XPL-TRACE SIMBIOSYS),. *000:25:890 READY. *000:29:281 APPLY-ACTION WINDOW; LISP-TRANSLATOR::AUTHORINGTOOL-TRANSLATOR, CONTEXT; 3FACTOR-CROSS-XPL-4, SELECTIONS; (GROUP4_CLASS_UNDER_XPL), ACTION; UPDATECOMBOBOX, INPUT; "The largest group is parental since crossovers are uncommon.",. *000:29:281 GOOD-PATH. *000:29:281 HISTORY P-1; (COMBOBOX-XPL-TRACE SIMBIOSYS),. *000:29:281 READY. *001:20:733 APPLY-ACTION WINDOW; LISP-TRANSLATOR::AUTHORINGTOOL-TRANSLATOR, CONTEXT; 3FACTOR-CROSS-XPL-4, SELECTIONS; (ORDER_GENES_OBS_XPL), ACTION; UPDATECOMBOBOX, INPUT; "The Q and q alleles have interchanged between the parental and SCO genotypes.",. *001:20:733 SWITCHED-TO-EDITOR. *001:20:748 NO-CONFLICT-SET. *001:20:748 READY. *001:32:498 APPLY-ACTION WINDOW; LISP-TRANSLATOR::AUTHORINGTOOL-TRANSLATOR, CONTEXT; 3FACTOR-CROSS-XPL-4, SELECTIONS; (ORDER_GENES_OBS_XPL), ACTION; UPDATECOMBOBOX, INPUT; "The Q and q alleles have interchanged between the parental and DCO genotypes.",. *001:32:498 GOOD-PATH. *001:32:498 HISTORY P-1; (COMBOBOX-XPL-TRACE SIMBIOSYS),. *001:32:498 READY. *001:37:857 APPLY-ACTION WINDOW; LISP-TRANSLATOR::AUTHORINGTOOL-TRANSLATOR, CONTEXT; 3FACTOR-CROSS-XPL-4, SELECTIONS; (ORDER_GENES_UNDER_XPL), ACTION; UPDATECOMBOBOX, INPUT; "In the DCO group BOTH outer genes cross over so the interchanged gene is the middle one.",. *001:37:857 GOOD-PATH Student Log Data
, ACTION; UPDATECOMBOBOX, INPUT; Two crossover events are very rare. ,. *000:25:890 GOOD-PATH. *000:25:890 HISTORY P-1; (COMBOBOX-XPL-TRACE SIMBIOSYS),. *000:25:890 READY. *000:29:281 APPLY-ACTION WINDOW; LISP-TRANSLATOR::AUTHORINGTOOL-TRANSLATOR, CONTEXT; 3FACTOR-CROSS-XPL-4, SELECTIONS; (GROUP4_CLASS_UNDER_XPL), ACTION; UPDATECOMBOBOX, INPUT; The largest group is parental since crossovers are uncommon. ,. *000:29:281 GOOD-PATH. *000:29:281 HISTORY P-1; (COMBOBOX-XPL-TRACE SIMBIOSYS),. *000:29:281 READY. *001:20:733 APPLY-ACTION WINDOW; LISP-TRANSLATOR::AUTHORINGTOOL-TRANSLATOR, CONTEXT; 3FACTOR-CROSS-XPL-4, SELECTIONS; (ORDER_GENES_OBS_XPL), ACTION; UPDATECOMBOBOX, INPUT; The Q and q alleles have interchanged between the parental and SCO genotypes. ,. *001:20:733 SWITCHED-TO-EDITOR. *001:20:748 NO-CONFLICT-SET. *001:20:748 READY. *001:32:498 APPLY-ACTION WINDOW; LISP-TRANSLATOR::AUTHORINGTOOL-TRANSLATOR, CONTEXT; 3FACTOR-CROSS-XPL-4, SELECTIONS; (ORDER_GENES_OBS_XPL), ACTION; UPDATECOMBOBOX, INPUT; The Q and q alleles have interchanged between the parental and DCO genotypes. ,. *001:32:498 GOOD-PATH. *001:32:498 HISTORY P-1; (COMBOBOX-XPL-TRACE SIMBIOSYS),. *001:32:498 READY. *001:37:857 APPLY-ACTION WINDOW; LISP-TRANSLATOR::AUTHORINGTOOL-TRANSLATOR, CONTEXT; 3FACTOR-CROSS-XPL-4, SELECTIONS; (ORDER_GENES_UNDER_XPL), ACTION; UPDATECOMBOBOX, INPUT; In the DCO group BOTH outer genes cross over so the interchanged gene is the middle one. ,. *001:37:857 GOOD-PATH Student Log Data.")
19
PSLC DataShop (Koedinger et al, 2008, 2010) >250,000 hours of students using educational software within LearnLabs and other settings >30 million student actions, responses & annotations
 >250,000 hours of students using educational software within LearnLabs and other settings >30 million student actions, responses & annotations")
20
How much data is big data?

21
2004 and 2014 2004: I reported a data set with 31,450 data points. People were impressed.

22
2004 and 2014 2004: I reported a data set with 31,450 data points. People were impressed. 2014: A reviewer in an education journal criticized me for referring to 817,485 data points as “big data”.

23
What’s does it mean to call data “big data”? Any thoughts?

24
Some definitions “Big data” is data big enough that traditional statistical significance testing becomes useless “Big data” is data too big to input into a traditional relational database “Big data” is data too big to work with on a single machine

25
What do you do when you have big data?

26
Analytics/Data Mining

27
Learning Analytics EDM and LA are closely related communities

28
Two communities Society for Learning Analytics Research – First conference: LAK2011 – Publishing JLA since 2014 International Educational Data Mining Society – First event: EDM workshop in 2005 (at AAAI) – First conference: EDM2008 – Publishing JEDM since 2009
 – First conference: EDM2008 – Publishing JEDM since 2009")
29
Key Distinctions (Siemens & Baker, 2012)
")
30
Key Distinctions: Origins LAK – Semantic web, intelligent curriculum, social networks, outcome prediction, and systemic interventions EDM – Educational software, student modeling, course outcomes

31
Key Distinctions: Modes of Discovery LAK – Leveraging and supporting human judgment is key; automated discovery is a tool to accomplish this goal – Information distilled and presented to human decision- maker EDM – Automated discovery is key; leveraging human judgment is a tool to accomplish this goal – Humans provide labels which are used in classifiers

32
Key Distinctions: Guiding Philosophy LAK – Stronger emphasis on understanding systems as wholes, in their full complexity – “Holistic” approach EDM – Stronger emphasis on reducing to components and analyzing individual components and relationships between them

33
Key Distinctions: Adaptation and Personalization LAK – Greater focus on informing and empowering instructors and learners and influencing the design of the education system EDM – Greater focus on automated adaption (e.g. by the computer with no human in the loop) and influencing the design of interactions
 and influencing the design of interactions.")
34
To Learn More About LA versus EDM Take HUDK4051: Learning Analytics: Process and Theory Spring 2016

35
Questions? Comments?

36
Tools There are a bunch of tools you can use in this class – I don’t have strong requirements about which tools you choose to use We’ll talk about them throughout the semester You may want to think about downloading or setting up accounts for – RapidMiner (I prefer 5.3. 6.0 is fine, I just will not be able to give as much tech support) – Python SciPy and NumPY; iPython Notebook – SAS OnDemand for Academics – Weka – Microsoft Excel – Java – Matlab No hurry, but keep it in mind…
 – Python SciPy and NumPY; iPython Notebook – SAS OnDemand for Academics – Weka – Microsoft Excel – Java – Matlab No hurry, but keep it in mind….")
37
Today’s Readings First, a no-penalty-or-punishment survey question

38
Today’s Readings Who read the Witten & Frank? Who watched the BDE video?

39
Questions? Comments? Concerns?

40
What is a prediction model?

41
What is a regressor?

42
What are some things you might use a regressor for? Bonus points for examples other than those in the BDE video

43
Let’s do an example Numhints = 0.12*Pknow + 0.932*Time – 0.11*Totalactions Skillpknowtimetotalactionsnumhints COMPUTESLOPE0.273?

44
Which of the variables has the largest impact on numhints? (Assume they are scaled the same)
")
45
However… These variables are unlikely to be scaled the same! If Pknow is a probability – From 0 to 1 And time is a number of seconds to respond – From 0 to infinity Then you can’t interpret the weights in a straightforward fashion What could you do?

46
Let’s do another example Numhints = 0.12*Pknow + 0.932*Time – 0.11*Totalactions Skillpknowtimetotalactionsnumhints COMPUTESLOPE0.2235?

47
Is this plausible?

48
What might you want to do if you got this result in a real system?

49
Transforms In the video, we talked about variable transforms Who here has transformed a variable (for an actual analysis)? What did you transform and why did you do it?

50
Variable Transformation: EDM versus statistics Statistics: fit data better AND avoid violating assumptions EDM: fit data better

51
Why don’t violations of assumptions matter in EDM? At least not the way they do in statistics…

52
Interpreting Regression Models Example from the video

53
Example of Caveat Let’s graph the relationship between number of graduate students and number of papers per year

54
Data

55
Model Number of papers = 4 + 2 * # of grad students - 0.1 * (# of grad students) 2 But does that actually mean that (# of grad students) 2 is associated with less publication? No!

56
Example of Caveat (# of grad students) 2 is actually positively correlated with publications! – r=0.46

57
Example of Caveat The relationship is only in the negative direction when the number of graduate students is already in the model…

58
How would you deal with this? How can we interpret individual features in a comprehensive model?

59
Other questions, comments, concerns about lecture?

60
RapidMiner 5.3 Who has gotten RapidMiner 5.3 installed? Who has completed a RapidMiner tutorial? Who has completed the RapidMiner walkthrough?

61
RapidMiner 5.3 exercise Go to the course website and download Sep10dataset.csv Data on the probability that a student error is careless Calculated as in (Baker, Corbett, & Aleven, 2008) Try to predict from other variables
 Try to predict from other variables")
62
RapidMiner tasks Build regressor to predict P(SLIP|TRIO) Look at model goodness Look at model Look at actual data and refine model Look at model goodness Build flat cross-validation Look at model goodness Build student-level cross-validation Look at model goodness
 Look at model goodness Look at model Look at actual data and refine model Look at model goodness Build flat cross-validation Look at model goodness Build student-level cross-validation Look at model goodness")
63
Questions? Comments? Concerns?

64
Questions about Basic HW 1?

65
Reminders You don’t have to do it perfectly, you just have to do it If you run into trouble, feel free to email me or, better yet, use the moodle discussion forum

66
Questions? Concerns?

67
Other questions or comments?

68
Next Class Monday, September 10 Classification Algorithms Baker, R.S. (2015) Big Data and Education. Ch. 1, V3, V4, RapidMiner Walkthrough. Witten, I.H., Frank, E. (2011) Data Mining: Practical Machine Learning Tools and Techniques. Ch. 4.6, 6.1, 6.2, 6.4 Hand, D. J. (2006). Classifier technology and the illusion of progress. Statistical science, 21(1), 1-14. Pardos, Z.A., Baker, R.S.J.d., Gowda, S.M., Heffernan, N.T. (2011) The Sum is Greater than the Parts: Ensembling Models of Student Knowledge in Educational Software. SIGKDD Explorations, 13 (2), 37-44. Basic HW 1 due
 Big Data and Education. Ch. 1, V3, V4, RapidMiner Walkthrough. Witten, I.H., Frank, E. (2011) Data Mining: Practical Machine Learning Tools and Techniques. Ch. 4.6, 6.1, 6.2, 6.4 Hand, D. J. (2006). Classifier technology and the illusion of progress. Statistical science, 21(1), Pardos, Z.A., Baker, R.S.J.d., Gowda, S.M., Heffernan, N.T. (2011) The Sum is Greater than the Parts: Ensembling Models of Student Knowledge in Educational Software. SIGKDD Explorations, 13 (2), Basic HW 1 due.")
69
The End

Similar presentations
 from some combination of other.>")


 Predicting.>")
