Download presentation
Presentation is loading. Please wait.

1
By Alex Fuehrer

2
Introduction Question- Is there statistical evidence that the water quality of the two sites of the flathead are different? Hypothesis- There will not be a very big difference in water quality between the two sites.

3
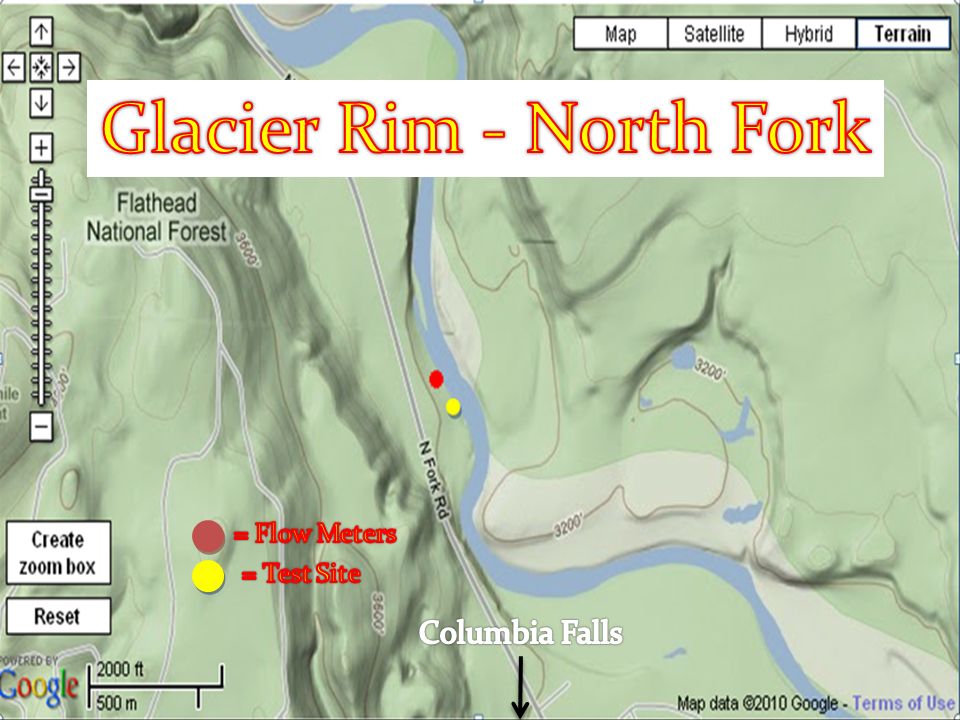
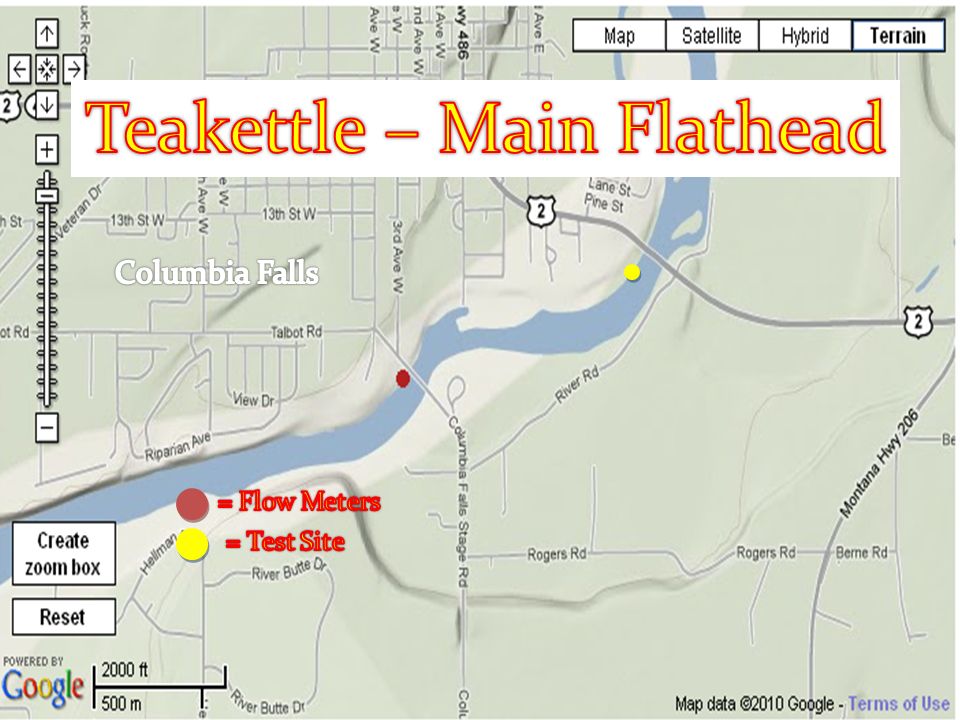
Testing sites Water samples taken from 2 sites 1. Glacier Rim Fishing Access- North Fork of Flathead 2. Teakettle Boat Ramp, Columbia Falls- Main Flathead

6
Tests Turbidity Temperature Ph Alkalinity Dissolved Oxygen Conductivity Nitrogen Phosphorous Hardness

7
Turbidity a.k.a Transparence Definition Indicates how well light passes directly through water from the surface down. Cause Nutrients attached sediments Snowmelt Range 1-50 NTU’s Problems Outside Range Limit amount of light reaching plants decreasing photosynthesis Suspending solid that can harbor bacteria

8
Temperature Range 5-20°C Problems Outside Range Effects the amount of dissolved oxygen in the water. Higher temperature+lower DO=bad for fish Effects the rate of photosynthesis by algae and larger aquatic rates of growth

9
Ph Definition Measures the H+ ion concentration Cause Natural changes due to local geology Range 0-14 ph Problems Outside Range Ph is important to many organism and they might die from charges

10
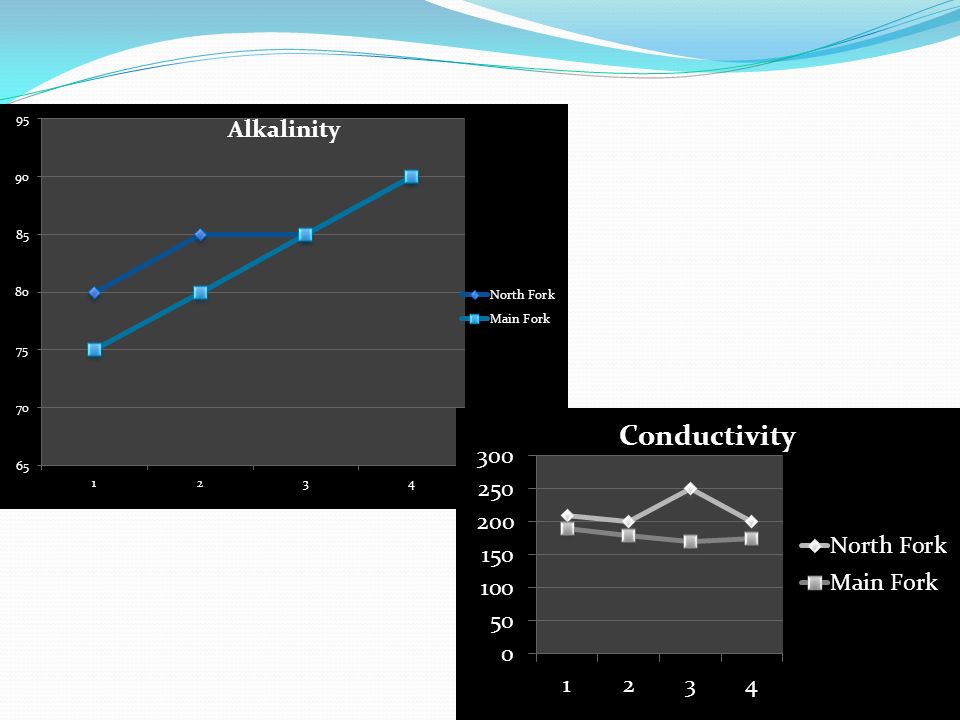
Alkalinity Definition Measure of the ability of a solution to neutralize acids to the equivalence point of carbonate or bicarbonate.. Cause Calcium carbonate in the water, which can come from rocks such as limestone or can be leached from dolomite and calcite in the soil. Range <500 mg/L Problems Outside Range Affects pH levels

11
Dissolved Oxygen Definition Simply means the amount of oxygen dissolved in water Cause Changes in temp Atmospheric pressure Aquatic bacteria Range Above 5 mg/liter for fish Problems Outside Range Low amount of DO can be lethal for fish

12
Conductivity Definition Measure of waters ability to pass an electrical current Cause Geology of the area the water passes through The presence of electrolytes Range 50-250 ms/cm Problems Outside Range Affects aquatic life

13
Nitrogen Definition Amount of NO3- Cause Runoff Agricultural wastes Range <1 mg/L Problems Outside Range Causes excess algae boom

14
Phosphorous Definition Amount of PO4³- Cause Runoff Range <.1 mg/L Problems Outside Range Causes excess algae boom Reduce DO

15
Hardness Definition Measures the amount of Calcium and Magnesium in water Cause Watershed Geology, substrate, soils, etc Climate and precipitation Ranges Soft 0-60 Moderate 61-120 Hard 121-180 Very Hard greater then 181 Problems Outside Range Fish cant handle low amounts of hardness as well as high concentrations

16
Averages TestGlacier Rim N.Fork Flathead TeaKettle Main Flathead Averages Turbidity0.00 NTU’s Temperature4.00˚C4.67˚C Ph8.73 Ph8.78 Ph Alkalinity85.00 mg/L82.50 mg/L Dissolved Oxygen7.00 mg/L7.50 mg/L Conductivity215.00 µ's/cm178.75 µ's/cm Nitrogen0.00 mg/L Phosphorous0.00 mg/L Hardness135.00 Calcium90.00100.00 Magnesium45.0035.00 Flow2033.33 ft³/sec3800.00 ft³/sec Gage Height1.92 ft3.32 ft

17
Ph

18
Dissolved Oxygen

20
Calcium and Magnesium Hardness

21
Statistics Test Two sample T-test Deals with means or averages Can be used to tell if there is statistical difference between the two sample test areas Put averages of all tests from North Fork in L1 And Main Fork averages in L2 Hypothesis Null Hypothesis H0: µ1=µ2 There is no difference between the averages from NF and MF Alternate Hypothesis H0: µ1≠µ2 There is a difference between the averages from NF and MF

22
Results t= -.406 p=.689 df=18.3 Since P-value is so high (p >.05) we fail to reject null hypothesis There is no statistical evidence to conclude that there is a difference in the mean averages between the North Fork and Main Fork of the Flathead River. Conclusion

23
Improvements/Changes Take more samples and more tests Better equipment Do all test in field Be more consistent

25
Questions??

Similar presentations


 Depends on…>")


Change 10 to 25% of the water within your tank. 2)If you are not helping your group change water, you need to be finishing the fish.>")