Download presentation
Presentation is loading. Please wait.

1
Where Does The Water Come From ?

4
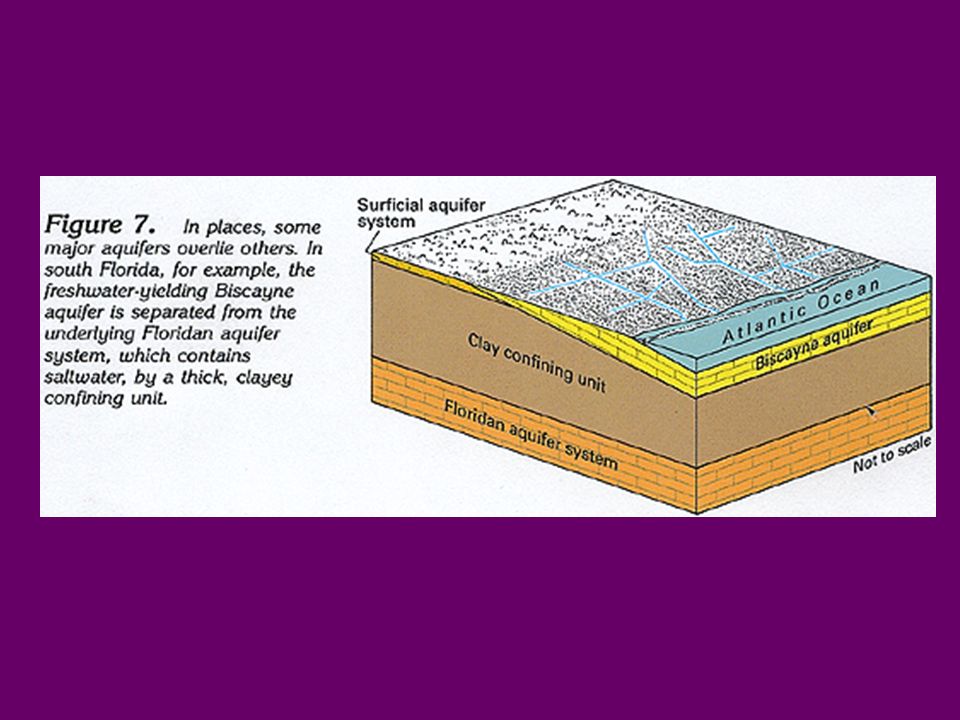
Soil Zone Sand and Gravel Aquifer Limestone or Granite Aquifer Sandstone Aquifer Examples of Variation in Groundwater Quality Well # 1Well # 2Well # 3

6
25 20 15 10 5 0 Frequency % Irrigation Water Alkalinity concentrations (ppm CaCO 3 ) from Florida <40 40–80 80-20 120-160 160-200 200-240 240-280 280-320 320-360 360-400 >400
 from Florida <40 40– >400")
7
The Goal Is To Achieve A Stable Medium pH Over Time

8
Plant Growth Cycle Active Growth Establishment Mature

9
pH affects the solubility of fertilizers, and the efficacy of pesticides and growth regulators. the higher the water pH the less soluble these materials are pHpH

10
pH Drift Alkaline Water pH NH 4 + fertilizers Time 8.58.07.57.06.56.05.55.04.5 “Optimum” Range

11
A measure of water’s ability to neutralize acids – a buffering ability A measure of water’s ability to neutralize acids – a buffering ability Mostly carbonates and bicarbonates – associated with Ca and Mg (limestone) Mostly carbonates and bicarbonates – associated with Ca and Mg (limestone) May cause pH to rise in media over time, especially in small containers May cause pH to rise in media over time, especially in small containers AlkalinityAlkalinity Note: Alkalinity “controls” pH Must know alkalinity to manage pH
 Mostly carbonates and bicarbonates – associated with Ca and Mg (limestone) May cause pH to rise in media over time, especially in small containers May cause pH to rise in media over time, especially in small containers AlkalinityAlkalinity Note: Alkalinity controls pH Must know alkalinity to manage pH")
12
Expressed in ppm, mg/L, meq/L Expressed in ppm, mg/L, meq/L Expressed as CaCO 3 or HCO 3 - Expressed as CaCO 3 or HCO 3 - AlkalinityAlkalinity Irrigation water should have an alkalinity of less than 100ppm; if higher than 150 ppm, acidification is needed Irrigation water should have an alkalinity of less than 100ppm; if higher than 150 ppm, acidification is needed

13
CaMg(CO 3 ) 2 Dolomitic limestone Ca 2+ + Mg 2+ + 2CO 3 2- Hardness Alkalinity Hardness and Alkalinity Generally Go Hand-In-Hand but They Are NOT One and the Same You Can Use the Water Hardness to Estimate Its Alkalinity
 2 Dolomitic limestone Ca 2+ + Mg CO 3 2- Hardness Alkalinity Hardness and Alkalinity Generally Go Hand-In-Hand but They Are NOT One and the Same You Can Use the Water Hardness to Estimate Its Alkalinity")
14
Alkalinity Terms Milliequivalents alkalinity mg/liter or ppm CaCO 3 of alkalinity 12345 mg/liter or ppm bicarbonate 5010015020025060122183244305

15
H 2 CO 3 2CO 3 2- + 2H + H 2 O + CO 2 Substrate Acidity Alkalinity Both the alkalinity and the acidity are neutralized

16
Sample A Sample B pH = 9 pH = 7 One drop of acid to get pH 6 Ten drops of acid to get pH 6 The Effect of Water Alkalinity on Media pH and Acid Requirement Little or no effect on the growing medium pH Increases growing medium pH Alk = 50 ppm Alk = 300 ppm

17
Action Steps To Correct High Alkalinity reverse osmosis acid injection acid fertilizer and/or none less lime Alkalinity (ppm) bicarbonate 480 180120
 bicarbonate")
18
Salinity Salinity is measured by Electro-conductivity Total Dissolved Salts (TDS) – all salts present in the water (1 mMho/cm=640 ppm) less than 0.75 mMho /cm for plugs less than 1.0 mMho /cm for other greenhouse crops less than 2.0 mMho /cm for other nursery crops
 – all salts present in the water (1 mMho/cm=640 ppm) less than 0.75 mMho /cm for plugs less than 1.0 mMho /cm for other greenhouse crops less than 2.0 mMho /cm for other nursery crops")
19
Testing The Soil Solution !

20
Simple technique for measuring pH and EC Simple technique for measuring pH and EC Charts for recording pH & EC Charts for recording pH & EC Guidelines for crops Guidelines for crops Procedures to keep on track Procedures to keep on track Pour Thru Method

21
6 or 8-inch saucers are adequate for collecting the leachate

22
Distilled Water Volumes 4 inch 5 inch 6 inch 6.5 inch 1 Qt 4 Qt 12 Qt 75757510075150350 2.52.52.53.52.55.012.0 Pot Size mloz

23
Flats: Use 50 ml Distilled Water

24
EC Comparisons 0 to 0.3 0.3 to 0.8 0.8 to 1.3 1.3 to 1.8 1.8 to 2.3 > 2.3 1:2SME PourThru Indication 0 to 0.8 0.8 to 2.0 2.0 to 3.5 3.5 to 5.0 5.0 to 6.0 > 6.0 0 to 1.0 1.0 to 2.6 2.6 to 4.6 4.6 to 6.5 6.6 to 7.8 > 7.8 Very Low LowNormalHigh Very High Extreme

25
Initial EC

26
Crop pH Ranges

27
Geraniums (6” pinched) 1/28 5/01 6.0 to 6.6 6.6 to 6.8 5.8 to 6.0
 1/28 5/ to to to 6.0")
Similar presentations