Download presentation
Presentation is loading. Please wait.

1
Impact of Tropical Easterly Waves during the North American Monsoon (NAM) using a Mesoscale Model Jennifer L. Adams CIMMS/University of Oklahoma Dr. David Stensrud NOAA/National Severe Storms Laboratory October 27, 2005

2
What is the NAM? Distinct shift in mid-level winds accompanied by an increase in rainfall Occurs over NW Mexico and SW United States Onset usually in July and decays in September Great deal of variability

3
NAM Moisture Source Moisture source current consensus –low-level moisture Gulf of California (GoC) –mid-level moisture Gulf of Mexico (GoM) Transport of low-level moisture by gulf surges (one way) Induced by passage of tropical easterly waves (TEWs) over GoC and/or outflow boundaries/gust fronts
 –mid-level moisture Gulf of Mexico (GoM) Transport of low-level moisture by gulf surges (one way) Induced by passage of tropical easterly waves (TEWs) over GoC and/or outflow boundaries/gust fronts")
4
Gulf surges Hales (1972) and Brenner (1974) Cooler temps, increased dewpoints, pressure rise, southerly wind Increase in convection Shallow vertical extent Loss of definition upon entering desert SW Adams and Comrie (1997)
 and Brenner (1974) Cooler temps, increased dewpoints, pressure rise, southerly wind Increase in convection Shallow vertical extent Loss of definition upon entering desert SW Adams and Comrie (1997)")
5
Motivation NAM predictability very low TEWs influential to strength of NAM Inverse relationship between NAM and U.S. central plains rainfall

6
Goals Explore impact of TEWs on the NAM – gulf surges – NAM region rainfall Control run of MM5 compared to simulation where TEWs are removed

7
Model Description Pennsylvania State University/National Center for Atmospheric Research Mesoscale Model (MM5) Model domain (350x180x23) at 25 km grid spacing Puerto Penasco
 Model domain (350x180x23) at 25 km grid spacing Puerto Penasco")
8
MM5 Parameterization Schemes Kain-Fritsch convective scheme (Kain and Fritsch 1990) MRF PBL scheme (Hong and Pan 1996) Simple water and ice microphysics (Dudhia 1989) Global terrain dataset – 10 minute resolution (25 USGS land use categories) Rapid Radiative Transfer Model for radiation 5-layer soil model (Dudhia 1996) Model initialization: NCEP/NCAR reanalysis data –supply boundary conditions every 6-h –GoC SSTs set to constant 29.0ºC
 MRF PBL scheme (Hong and Pan 1996) Simple water and ice microphysics (Dudhia 1989) Global terrain dataset – 10 minute resolution (25 USGS land use categories) Rapid Radiative Transfer Model for radiation 5-layer soil model (Dudhia 1996) Model initialization: NCEP/NCAR reanalysis data –supply boundary conditions every 6-h –GoC SSTs set to constant 29.0ºC")
9
Methodology Four one-month periods –July 1990, July 1992, August 1988, August 1986 ECMWF reanalysis data and CPC precipitation analysis Varying number of TEWs and rainfall amounts

10
ECMWF Hövmoller Diagrams (850 mb) July 1990 August 1986 July 1992 August 1988
 July 1990 August 1986 July 1992 August 1988")
11
Methodology Harmonic analysis to remove TEWs from boundary conditions –Reed et al. (1977) – TEWs average wavelength 2500 km, propagation speed of 8 m/s, and average period of 3.5 days TEWs with periods of approx. 3.5-7.5 days identified – amplitudes replaced with value of zero south of 30ºN –T, q, u, v, ght, and slp
 – TEWs average wavelength 2500 km, propagation speed of 8 m/s, and average period of 3.5 days TEWs with periods of approx days identified – amplitudes replaced with value of zero south of 30ºN –T, q, u, v, ght, and slp.")
13
Harmonics Harmonic Period (days) A31 B15.5 C10.33 D7.75 E6.20 F5.17 G4.43 H3.88 I3.44 J3.10
 A31 B15.5 C10.33 D7.75 E6.20 F5.17 G4.43 H3.88 I3.44 J3.10")
14
Harmonic Amplitudes (~40˚W) TEWNo-TEW August 1988 Harmonic E
 TEWNo-TEW August 1988 Harmonic E")
15
MM5 Hövmoller Diagrams (700 mb) TEW No TEW
 TEW No TEW")
16
Results 18 surges over 4 months examined –17 induced by TEW/tropical storm Varying degrees of strength and frequency Month # of surges August 1986 6 August 1988 4 July 1990 5 July 1992 3

17
Surge Criteria Used time-series data at Puerto Penasco, Mexico as a “first pass” to ID surge events Surges occur when: –winds shift to southerly –maximum daily dewpoint exceeding 65ºF for at least 2 days –peak wind speeds greater than 5 m/s –decrease in daily max temp of greater than 5ºF from the previous day

18
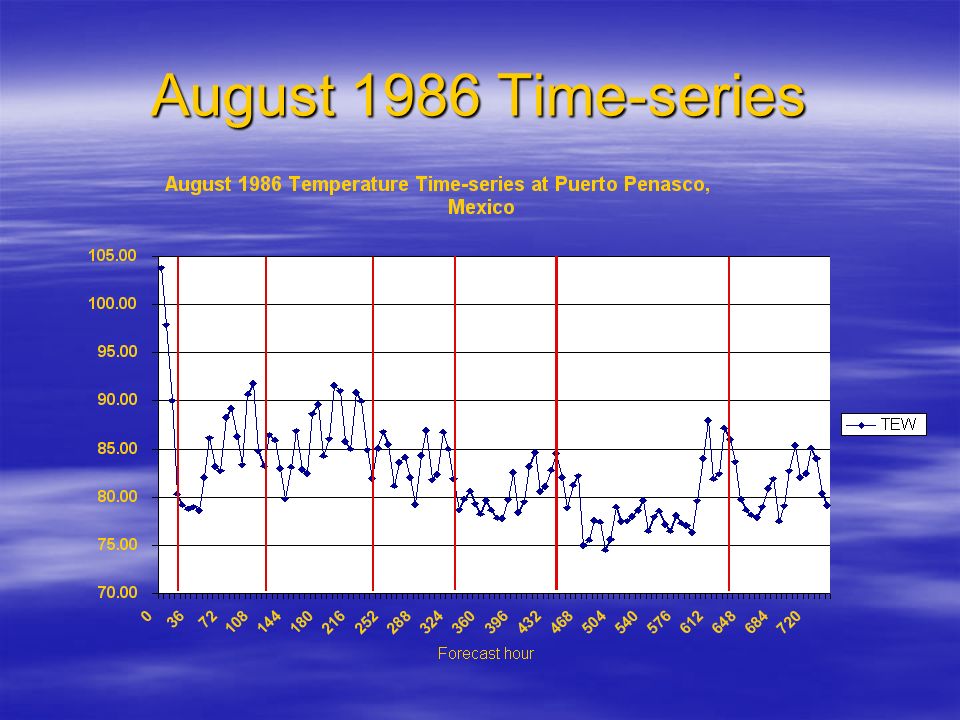
August 1986 Time-series

20
August 1986 Results 6 surges in the control run –all show up in the time-series data at Puerto Penasco 5 induced by TEWs and 1 initiated by a tropical storm (Howard?) 2 TEWs possibly contained in the model initial conditions
 2 TEWs possibly contained in the model initial conditions")
21
TEW passage (18Z Aug 26) TEW No TEW
 TEW No TEW")
22
Pre-surge (18Z Aug 26) TEWNo TEW
 TEWNo TEW")
23
Surge onset (06Z Aug 27) TEWNo TEW
 TEWNo TEW")
24
Surge (12Z Aug 28) TEWNo TEW
 TEWNo TEW")
25
Post-surge (12Z Aug 29) TEWNo TEW
 TEWNo TEW")
26
Surge summary TEW passage 12 hours prior to surge onset Entire GoC shifts to southerly winds –10 of 18 surges (most common) Surge virtually absent from no-TEW simulation
 Surge virtually absent from no-TEW simulation")
27
TEWs and NAM rainfall Absence of TEWs has impact on precipitation amounts over the NAM region Many areas receive more rainfall when TEWs are present Influences overall extent of NAM precipitation

28
August 1988 Rainfall Differences (TEW-no TEW)
")
29
Central Plains Rainfall Differences (TEW-no TEW) August 1988
 August 1988")
30
Meridional Moisture Flux

31
Rainfall Differences (00Z Aug 17- 06Z Aug 23) August 1988
 August 1988")
32
Rainfall Differences -- 12Z Aug 19 - 00Z Aug 25 August 1986

33
Meridional Moisture Flux

34
Precipitable Water

35
Mid-latitude forcing -- 12Z Aug 20, 1986 TEWNo TEW

36
Adding TEWs July 1992 --> weak monsoon season July 1990 --> strong monsoon season July 1990 --> strong monsoon season Removed waves from July 1992 boundary conditions Inserted July 1990 TEWs into July 1992 boundary conditions

37
MM5 Hövmoller Diagrams Hybrid July 1992

38
12Z July 19 Hybrid run TEW passage

39
Surge (00Z July 20) HybridJuly 1992
 HybridJuly 1992")
40
Hybrid - July 1992 TEW Run

41
Conclusions Harmonic analysis successfully removes TEWs from the model boundary conditions MM5 reproduces surges over the GoC –full gulf, partial gulf, and SMO NAM shows great deal of interannual variability Surges impacted by absence of TEWs

42
Conclusions Reduction of surge events in the no-TEW run reduced rainfall amounts over the NAM region Absence of TEWs increases precipitation over the central United States –CAPE –mid-latitude forcing Adding waves enhances NAM –more distinct surge events –increase in rainfall over core monsoon region

43
Harmonic Analysis Since the model data used to create the boundary conditions are equally spaced in time and contain no missing values, the model data can be represented exactly as a series of n points in time by summing a series of n/2 harmonic functions….

Similar presentations


 He1 Coupling MM5 with ISOLSM: Development, Testing, and Application W.J. Riley, H.S. Cooley, Y. He*, M.S. Torn Lawrence Berkeley National.>")


 to Planetary Boundary Layer Parameterizations SCOTT A. BRAUN AND WEI-KUO TAO PRESENTATION.>")


 Michael.>")


 JungHoon Shin and Da-Lin Zhang Department of Atmospheric & Oceanic.>")
