Download presentation
Presentation is loading. Please wait.

1
Neag School of Education Response to Intervention III SW Behavioral Assessment George Sugai Director CBER Co-Director Center on PBIS www.CBER.org www.PBIS.org

2
PURPOSE Extend RtI discussion from individual/classroom to school-wide data-based decision making & interventions Brief RtI-SWPBS Review SW data-based decision making Data-based interventions

3
www.cber.org
4
www.pbis.org
6
BIG IDEA Successful individual student behavior support is linked to host environments or school climates that are effective, efficient, relevant, durable, & scalable (Zins & Ponti, 1990)
")
7
Evaluation Criteria

8
SYSTEMS PRACTICES DATA Supporting Staff Behavior Supporting Student Behavior OUTCOMES Supporting Social Competence & Academic Achievement Supporting Decision Making Integrated Elements

9
RtI

10
RtI: Good “IDEiA” Policy Approach or framework for redesigning & establishing teaching & learning environments that are effective, efficient, relevant, & durable for all students, families & educators NOT program, curriculum, strategy, intervention NOT limited to special education NOT new

12
Primary Prevention: School-/Classroom- Wide Systems for All Students, Staff, & Settings Secondary Prevention: Specialized Group Systems for Students with At-Risk Behavior Tertiary Prevention: Specialized Individualized Systems for Students with High-Risk Behavior ~80% of Students ~15% ~5% CONTINUUM OF SCHOOL-WIDE INSTRUCTIONAL & POSITIVE BEHAVIOR SUPPORT ALL SOME FEW

13
All Some Few RTI Continuum of Support for ALL Dec 7, 2007

14
Questions to Ponder What is “scientifically/evidence-based” intervention/practice? How do we measure & ensure “fidelity of implementation?” How do we determine “non-responsiveness?” Can we affect “teacher practice?” Do we have motivation to increase efficiency of “systems” organization? ???

15
Possible RtI Outcomes Gresham, 2005 ResponderNon-Responder High Risk False + Adequate response True + Inadequate response No Risk True – Adequate response False – Inadequate response

16
Avoiding False +/-

23
Need for….

24
SWPBS Conceptual Foundations Behaviorism ABA PBS SWPBS Laws of Behavior Applied Behavioral Technology Social Validity All Students

25
Primary Prevention: School-/Classroom- Wide Systems for All Students, Staff, & Settings Secondary Prevention: Specialized Group Systems for Students with At-Risk Behavior Tertiary Prevention: Specialized Individualized Systems for Students with High-Risk Behavior ~80% of Students ~15% ~5% CONTINUUM OF SCHOOL-WIDE INSTRUCTIONAL & POSITIVE BEHAVIOR SUPPORT ALL SOME FEW

26
Agreements Team Data-based Action Plan ImplementationEvaluation GENERAL IMPLEMENTATION PROCESS

27
VIOLENCE PREVENTION Surgeon General’s Report on Youth Violence (2001) Coordinated Social Emotional & Learning (Greenberg et al., 2003) Center for Study & Prevention of Violence (2006) White House Conference on School Violence (2006) Positive, predictable school-wide climate High rates of academic & social success Formal social skills instruction Positive active supervision & reinforcement Positive adult role models Multi-component, multi-year school-family-community effort
 Coordinated Social Emotional & Learning (Greenberg et al., 2003) Center for Study & Prevention of Violence (2006) White House Conference on School Violence (2006) Positive, predictable school-wide climate High rates of academic & social success Formal social skills instruction Positive active supervision & reinforcement Positive adult role models Multi-component, multi-year school-family-community effort")
28
Classroom SWPBS Practices Non-classroom Family Student School-wide Smallest # Evidence-based Biggest, durable effect

29
1.Leadership team 2.Behavior purpose statement 3.Set of positive expectations & behaviors 4.Procedures for teaching SW & classroom-wide expected behavior 5.Continuum of procedures for encouraging expected behavior 6.Continuum of procedures for discouraging rule violations 7.Procedures for on-going data-based monitoring & evaluation School-wide

30
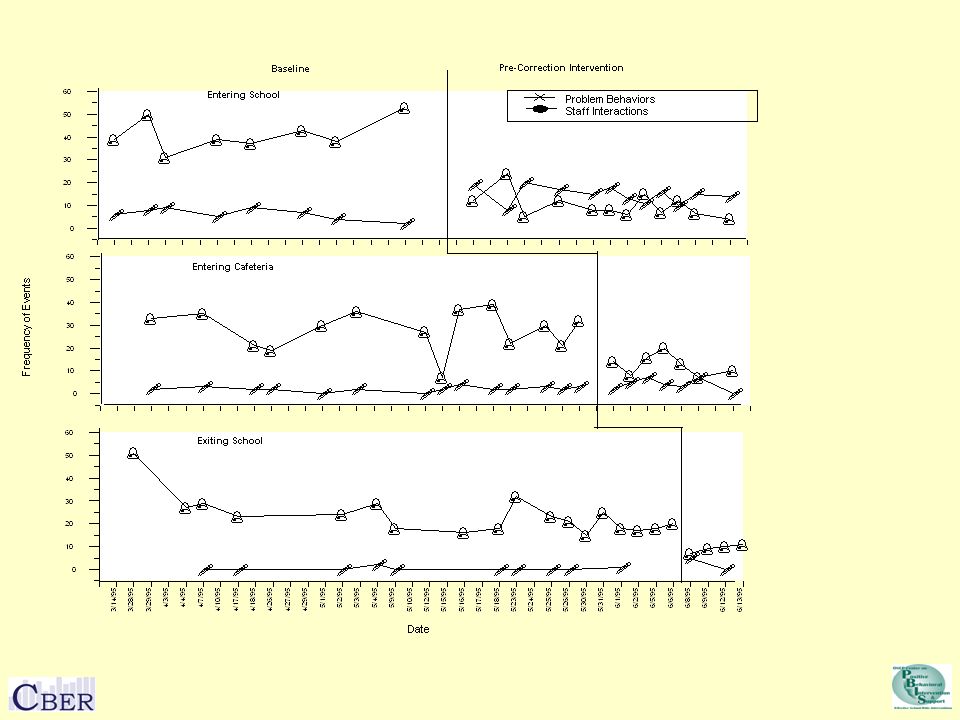
Positive expectations & routines taught & encouraged Active supervision by all staff –Scan, move, interact Precorrections & reminders Positive reinforcement Non-classroom

33
Franzen, K., & Kamps, D. (2008).
.")
34
Classroom-wide positive expectations taught & encouraged Teaching classroom routines & cues taught & encouraged Ratio of 6-8 positive to 1 negative adult- student interaction Active supervision Redirections for minor, infrequent behavior errors Frequent precorrections for chronic errors Effective academic instruction & curriculum Classroom

35
Allday & Pakurar (2007)
")
36
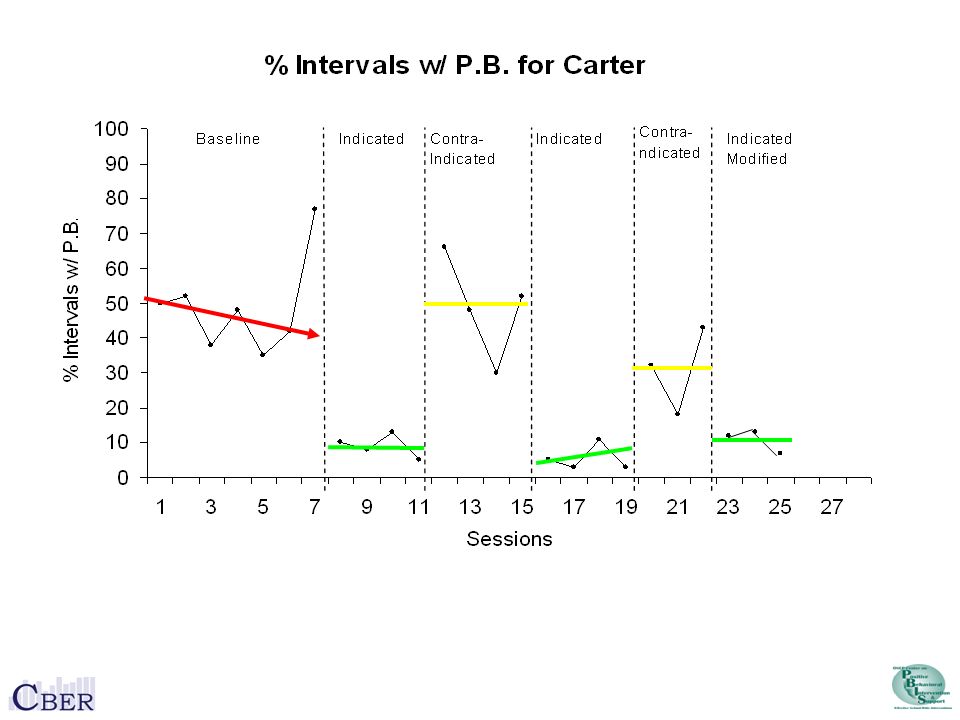
School Days Percent of Intervals Engaged in Problem Behavior Class B Results

37
GOALS8:309:3010:3011:3012:301:30 1. RESPECT OTHERS2 1 0 2. MANAGE SELF2 1 0 3. SOLVE PROBLEMS RESPONSIBLY 2 1 0 Name________________ Date ________ Rating Scale 2 = Great 1 = Ok 0 = Goal Not Met Goal _____ Pts Possible _____ Pts Received_____ % of Pts _____ Goal Met? Y N Check In/Out Pt Card

38
School Days Percent of Intervals Engaged in Problem Behavior Class B Results + Composite Peers Peer

39
Percent of Intervals Engaged in Problem Behavior Study 2 Results School Days

40
Percent of Intervals Engaged in Problem Behavior Peer Study 2 Results + Composite Peer

43
Behavioral competence at school & district levels Function-based behavior support planning Team- & data-based decision making Comprehensive person-centered planning & wraparound processes Targeted social skills & self-management instruction Individualized instructional & curricular accommodations Individual Student

44
Ingram, Lewis-Palmer, & Sugai, 2005

46
Continuum of positive behavior support for all families Frequent, regular positive contacts, communications, & acknowledgements Formal & active participation & involvement as equal partner Access to system of integrated school & community resources Family

47
~80% of Students ~15% ~5% ESTABLISHING CONTINUUM of SWPBS SECONDARY PREVENTION Check in/out Targeted social skills instruction Peer-based supports Social skills club TERTIARY PREVENTION Function-based support Wraparound Person-centered planning PRIMARY PREVENTION Teach SW expectations Proactive SW discipline Positive reinforcement Effective instruction Parent engagement SECONDARY PREVENTION TERTIARY PREVENTION PRIMARY PREVENTION

48
~80% of Students ~15% ~5% ESTABLISHING A CONTINUUM of SWPBS SECONDARY PREVENTION Check in/out Targeted social skills instruction Peer-based supports Social skills club TERTIARY PREVENTION Function-based support Wraparound/PCP Specialized individualised supports PRIMARY PREVENTION Teach & encourage positive SW expectations Proactive SW discipline Effective instruction Parent engagement Audit 1.Identify existing practices by tier 2.Specify outcome for each effort 3.Evaluate implementation accuracy & outcome effectiveness 4.Eliminate/integrate based on outcomes 5.Establish decision rules (RtI) Practice Selection Evidence-based Measurable outcome aligned with need & student Rules for data-based decisions Integrated with related practices based on outcomes, need, student Implementation fidelity Continuous monitoring
 Practice Selection Evidence-based Measurable outcome aligned with need & student Rules for data-based decisions Integrated with related practices based on outcomes, need, student Implementation fidelity Continuous monitoring")
49
Self-Assessment Efficient Systems of Data Management Team-based Decision Making Evidence- Based Practices Multiple Systems Existing Discipline Data Data-based Action Plan SWIS

51
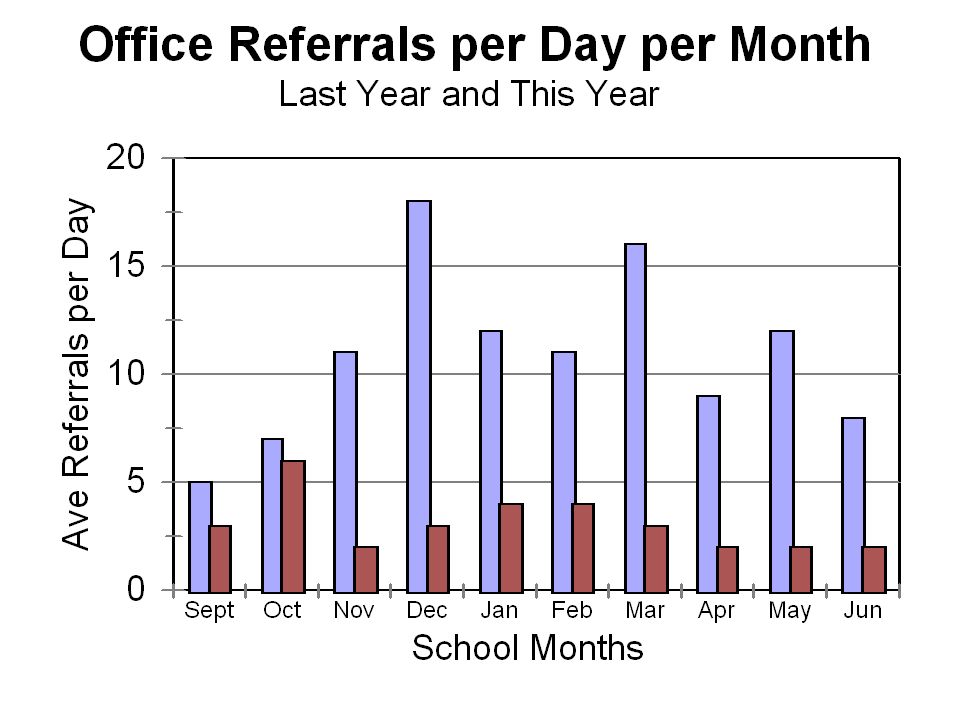
Office Discipline Referrals Definition –Kid-Teacher-Administrator interaction –Underestimation of actual behavior Improving usefulness & value –Clear, mutually exclusive, exhaustive definitions –Distinction between office v. classroom managed –Continuum of behavior support –Positive school-wide foundations –W/in school comparisons

53
Referrals by Problem Behavior

54
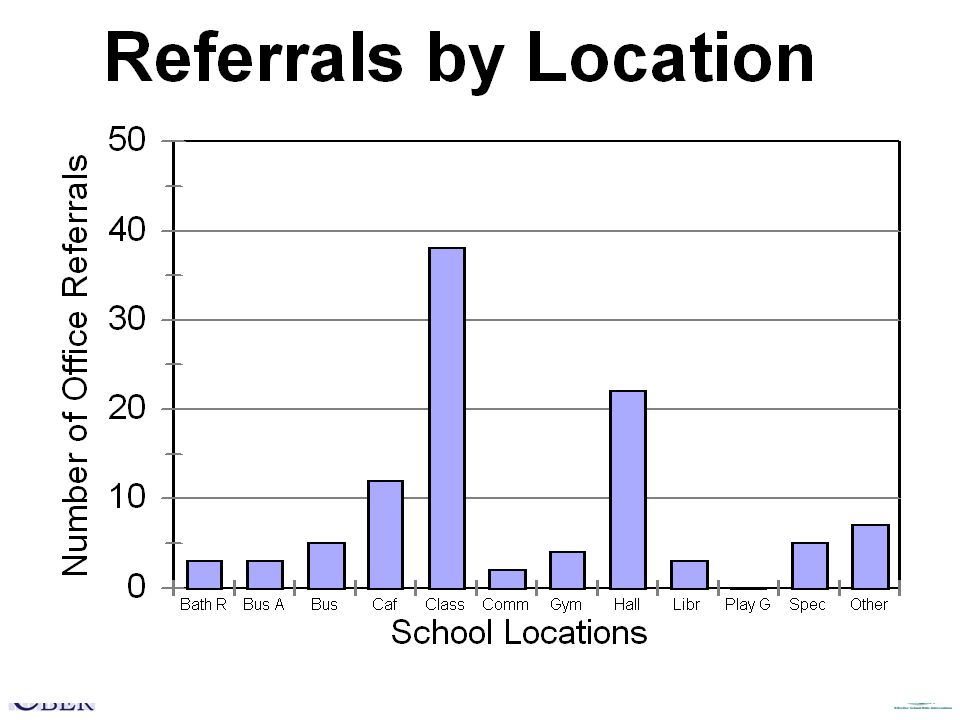
Referrals per Location

55
Referrals per Student

56
Referrals by Time of Day

57
www.swis.org
58
84% 58% 11% 22% 05% 20% SWPBS schools are more preventive

59
88%69% 08% 17% 04% 14% SWPBS schools are more preventive

60
SWIS summary 07-08 July 2, 2008 2,717 sch, 1,377,989 stds; 1,232,826 Maj ODRs Grade Range# SchoolsMean Enroll. Mean ODRs/100/ sch day (std dev.) K-61,756445..35 (.45) 1/300 day 6-9476654.91 (1.40) 1/100 /day 9-121779101.05 (1.56) 1/105/day K-(8-12)3084011.01 (1.88) 1/100 /day
 K-61, (.45) 1/300 day (1.40) 1/100 /day (1.56) 1/105/day K-(8-12) (1.88) 1/100 /day.")
61
National ODR/ISS/OSS July 2008 K-66-99-12 # Sch1756476177 # Std781,546311,725161,182 # ODR423,647414,716235,279 ISS# Evnt638 avg/100# Day124961 OSS# Evnt63024 avg/100# Day107461 # Expl0.030.290.39 2409 1,254,453 1,073,642

62
July 2, 2008 ODR rates vary by level

63
July 2, 2008

65
Pre Post

67
Elementary School Suspension Rate

68
Elementary School

70
Middle School Suspension Rate

71
Middle School

72
FC, MD Trends in Suspension Rates for PBS Schools Implementing w/ Fidelity & Maturity

73
FC, MD Trends in Black & Hispanic Suspension Rates for PBS Schools Implementing w/ Fidelity & Maturity

74
www.pbis.org Horner, R., & Sugai, G. (2008). Is school-wide positive behavior support an evidence-based practice? OSEP Technical Assistance Center on Positive Behavioral Interventions & Support.

75
90-School Study Horner et al., in press Schools that receive technical assistance from typical support personnel implement SWPBS with fidelity Fidelity SWPBS is associated with ▫ Low levels of ODR ▫.29/100/day v. national mean.34 ▫ Improved perception of safety of the school ▫ reduced risk factor ▫ Increased proportion of 3 rd graders who meet state reading standard.

76
Project Target: Preliminary Findings Bradshaw & Leaf, in press PBIS (21 v. 16) schools reached & sustained high fidelity PBIS increased all aspects of organizational health Positive effects/trends for student outcomes –Fewer students with 1 or more ODRs (majors + minors) –Fewer ODRs (majors + minors) –Fewer ODRs for truancy –Fewer suspensions –Increasing trend in % of students scoring in advanced & proficient range of state achievement test
 schools reached & sustained high fidelity PBIS increased all aspects of organizational health Positive effects/trends for student outcomes –Fewer students with 1 or more ODRs (majors + minors) –Fewer ODRs (majors + minors) –Fewer ODRs for truancy –Fewer suspensions –Increasing trend in % of students scoring in advanced & proficient range of state achievement test.")
77
N = 59 N = 128 12 schools25 schools

78
N = 59 12 schools N = 128 25 schools

79
4J School District Eugene, Oregon Change in the percentage of students meeting the state standard in reading at grade 3 from 97-98 to 01- 02 for schools using PBIS all four years and those that did not.

80
.64.85 Schools using SW-PBS report a 25% lower rate of ODRs

82
N =23N = 8 N = 23 N = 8

83
ODR Instruc. Benefit Springfield MS, MD 2001-2002 2277 2002-2003 1322 = 955 42% improvement = 42,975 min. @ 45 min. = 716.25 hrs = 119 days Instruc. time

84
ODR Admin. Benefit Springfield MS, MD 2001-2002 2277 2002-2003 1322 = 955 42% improvement = 14,325 min. @15 min. = 238.75 hrs = 40 days Admin. time

85
“Mom, Dad, Auntie, & Jason” In a school where over 45% of 400 elem. students receive free-reduced lunch, >750 family members attended Family Fun Night.

86
I like workin’ at school After implementing SW-PBS, Principal at Jesse Bobo Elementary reports that teacher absences dropped from 414 (2002-2003) to 263 (2003- 2004).
 to 263 ( ).")
87
“I like it here.” Over past 3 years, 0 teacher requests for transfers

88
“She can read!” With minutes reclaimed from improvements in proactive SW discipline, elementary school invests in improving school- wide literacy. Result: >85% of students in 3 rd grade are reading at/above grade level.

89
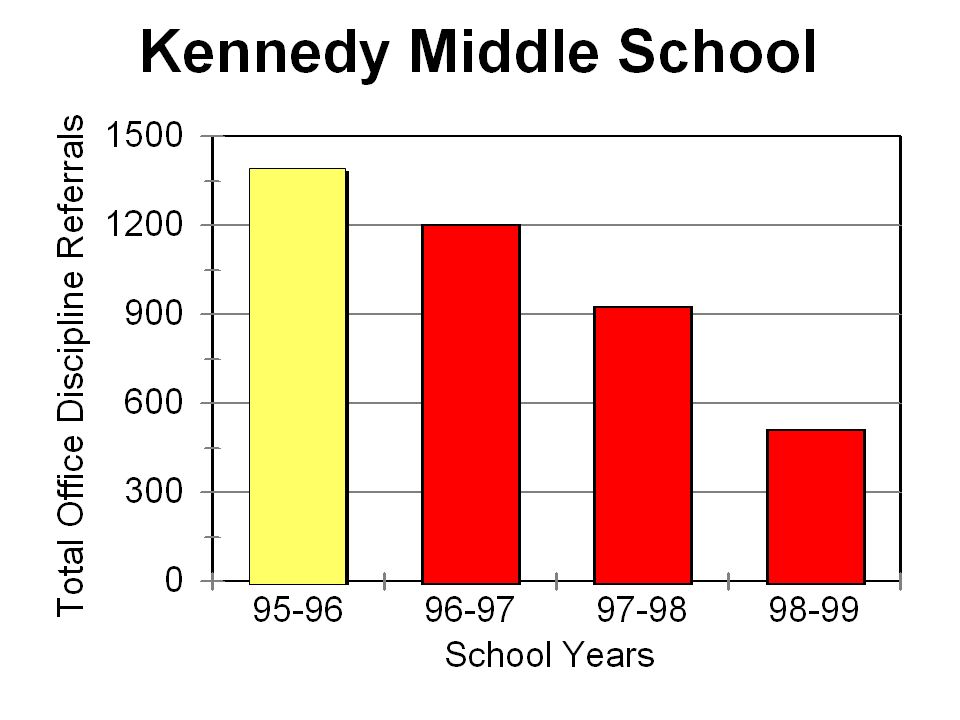
“We found some minutes?” After reducing their office discipline referrals from 400 to 100, middle school students requiring individualized, specialized behavior intervention plans decreased from 35 to 6.

90
Measurable & justifiable outcomes On-going data-based decision making Evidence-based practices Systems ensuring durable, high fidelity of implementation PBIS Messages

92
George.sugai@uconn.edu Robh@uoregon.edu www.CBER.org www.PBIS.org

Similar presentations


 Metro RIP (Regional Implementation Project) November 6, 2013 Shoreview Community Center T. J. Larson, MAT Barack.>")


