Download presentation
Presentation is loading. Please wait.

1
Evaluation of the 2 x 24hour voiding diary Sandor LOVASZ MD. PhD. Hungary, Semmelweis Medical University, Budapest ESSIC Annual Meeting Philadelphia, June 13-15, 2014 THE GAG-LAYER INTEGRITY TEST

2
Pathogenesis of BPS/IC: Abnormal epithelial permeability, epithelial leak, increased potassium absorption… Corrupted GAG layer integrity /insufficiency Emerging need of objective and quantitative testing of GAG layer integrity (uncertain and difficult diagnosis) Parsons CL.: J Urol, 1998
 Parsons CL.: J Urol, 1998")
3
Potassium sensitivity test (PST) - Parsons test Sensitivity – 69,5% Specificity – 50% (Chambers GK et al: J Urol 1999) Invasive (catheterization, bladder filling twice, painful, non- quantitative: yes or no) Absence of potassium sensitivity in normal controls Not used as a routine clinical test in monitoring of BPS/IC treatment efficacy. Parsons CL.: Urology. 2001

4
Modified potassium sensitivity-test (0,2M KCl) Comparing C (max) using Saline vs. Potassium solution Painless examination yet invasive and time consuming (catheterization + repeated cystometry) Cut off value at 30% growth Non-quantitative (=> or <30%) Although theoretically capable of quantitative measurement - clinically rarely used Daha LK, Riedl CR et al: Eur Urol 2005
 Cut off value at 30% growth Non-quantitative (=> or <30%) Although theoretically capable of quantitative measurement - clinically rarely used Daha LK, Riedl CR et al: Eur Urol")
5
Our observation is based on anamnestic data of 106 BPS/IC patients: Symptoms usually worsen in summer period Increased liquid consumption leads to remarkably reduced symptoms (pain, urgency) Is there a role of concentration of urine? Can these observations be used for quantitative testing?

6
We asked patients to make a voiding diary by recording total urine volume and average urine portion One patient recorded these data over 14 consecutive days from misunderstanding.

8
Another sample of a 15 day voiding diary

9
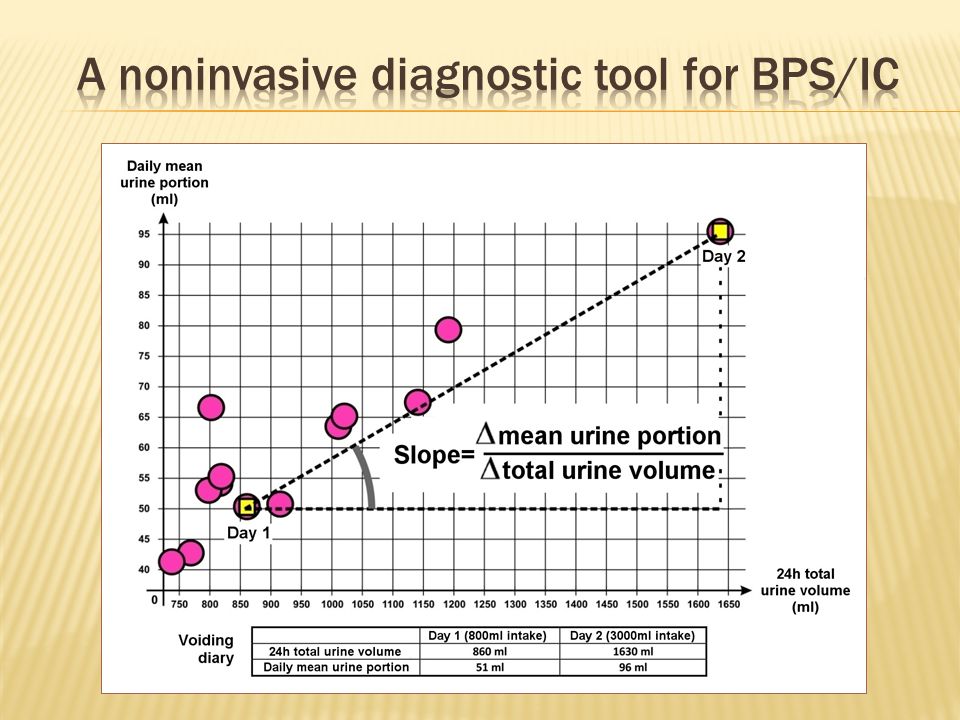
Patients were asked to calculate and record Average daily urine portion 24 hours full urine volume Throughout 2 consecutive days Day 1 - max 800ml drinking (max. concentrated) Day 2 - min 3000ml fluid intake (max. diluted) The growth of mean daily urine portion was observed The 2 x 24 hour voiding diary
 Day 2 - min 3000ml fluid intake (max. diluted) The growth of mean daily urine portion was observed The 2 x 24 hour voiding diary.")
16
Our hypotheses (based on these observations) There is a linear correlation between total urine volume (concentration of urine) and average portion The rate of change in average portion corresponds to severity of symptoms in IC/PPS Average urine portion is constant in healthy people, independently from urine volume (concentration) 5 healthy volunteers: Vol. constant Vol. : 20-50% Vol. : 100-300%

17
www.bladderpain.eu Continuous follow up on the website

18
Continuous follow up on the website

19
Continuous follow up on the website

20
Continuous follow up on the website

21
Continuous follow up on the website

22
Impressive correlation between - IC symptoms - Changes of mean urine portions By proving this correlation we could get a test for GAG layer integrity Noninvasive Painless Quantitative Not bound to the presence of investigator Suitable for diagnostic purposes Appropriate for long term follow up Continuous follow up on the website

23
We are seeking for partners for a prospective, multicenter clinical trial To collect pre- and post-treatment data of IC/BPS patients and To statistically prove correlation between Quantitatively measurable values of Symptoms and GAG integrity-test.

Similar presentations