Download presentation
Presentation is loading. Please wait.

1
Reconstruction of Molecule Shape from Data Obtained by Small Angle Neutron Scattering (SANS) E. Badita 1, C. Biris 2, I. Patrascu 1 1 University of Bucharest, Romania 2 West University of Timisoara, Romania Joint Institute for Nuclear Research, Dubna – Student Summer Practice 2007

2
INTRODUCTION Neutron scattering is the process of collision between neutrons emitted by a source and a target which is the studied sample Usually the scattering angles of these collisions are very small (the emerging beam is very close to the axis of the emitted neutrons) and is referred to as Small Angle Neutron Scattering (SANS) In optimum conditions with good detectors, the minimum scattered intensity measurable during a reasonable time interval is of the scale 0.01 cm -1 Typical SANS applications include: Biology Organization of biomolecular complexes in solution Mechanisms and pathways for protein folding Polymers Conformation of polymer molecules in solution Structure of microphase for separated block polymers Chemistry Structure and interactions in colloid suspensions Mechanisms of molecular self-assembly in solutions Materials Technology Analysis of ferrofluids Crystalline structure investigations
 and is referred to as Small Angle Neutron Scattering (SANS) In optimum conditions with good detectors, the minimum scattered intensity measurable during a reasonable time interval is of the scale 0.01 cm -1 Typical SANS applications include: Biology Organization of biomolecular complexes in solution Mechanisms and pathways for protein folding Polymers Conformation of polymer molecules in solution Structure of microphase for separated block polymers Chemistry Structure and interactions in colloid suspensions Mechanisms of molecular self-assembly in solutions Materials Technology Analysis of ferrofluids Crystalline structure investigations")
3
IBR – 2 Reactor YuMO Spectrometer: 1 – reflectors; 2 – chopper; 4,6 – collimator; 8 – sample table; 11,12 – detectors; 14 – direct beam detector Reactor parameters: Mean power 2 MW, in pulse 1500 MW Pulse frequency of 5 Hz Spectrometer parameters: Wavelength 0.5 A to 8 A Size range of object 500 A – 10 A Size of beam on sample 8 – 22 mm 2 Detectors of 3 He (home made) Detector for direct beam of 6 Li (home made) EQUIPMENT
 Detector for direct beam of 6 Li (home made) EQUIPMENT")
4
Sample Holder

5
A typical sans result is a graphic of the Scattering Intensity function of a wavevector Q Q is defined as where Q = wavevector Theta = scattering angle Lambda = Wavelength of incident beam The scattering intensity is defined as: Where I(Q) = scattering intensity Phi = density of particles in volume P(Q) = form factor S(Q) = structure factor SANS PRINCIPLE J. Texeira, Introduction to Small Angle Neutron Scattering Applied to Colloidal Science, Kluwer Academic Publishers, Netherlands, 1992

6
FORM FACTOR Concerns each particle and is related to its nuclear density Usually defined as: Where F(Q) is defined as: Rho is the density of scattering length of the sample It can be calculated using a simple formula (given here for heavy water): Where b is the scattering length of deuterium respectively oxygen STRUCTURE FACTOR Is related to the spatial distribution of the centres of mass Is usually defined as Where R is the position vector of a particle inside the compound FORM AND STRUCTURE FACTORS
 is defined as: Rho is the density of scattering length of the sample It can be calculated using a simple formula (given here for heavy water): Where b is the scattering length of deuterium respectively oxygen STRUCTURE FACTOR Is related to the spatial distribution of the centres of mass Is usually defined as Where R is the position vector of a particle inside the compound FORM AND STRUCTURE FACTORS")
7
Contrast variation is used when the sample being studied is made up of a series of compounds with close scattering lengths One of the most important advantages of SANS spectroscopy is the ability to change contrast by isotope substitution The most common form of substitution is changing hydrogen compounds with deuterium ones Another interesting situation appears when a mixture of normal and deuterated solvents are obtained in colloidal suspensions in such a way that the background scattering length of the solvent is “erased”. This is called contrast matching We can take as an example a sample containing three compounds and, using contrast matching, we can erase the contrast between two parts allowing us to analyze the third compound CONTRAST VARIATION METHODS

8
In order to study the results of SANS experiments, a number of computer software packages have been created We will give a very short presentation of two of these packages, GNOM and DAMMIN GNOM GNOM is an indirect transform program for small-angle scattering data processing It reads one-dimensional scattering curves and evaluates a distance distribution function p(r) for monodisperse systems or a size distribution function D(R) for polydisperse systems Distance distribution function obtained using GNOMFit of experimental data using GNOM COMPUTER ANALYSIS SOFTWARE
 for monodisperse systems or a size distribution function D(R) for polydisperse systems Distance distribution function obtained using GNOMFit of experimental data using GNOM COMPUTER ANALYSIS SOFTWARE")
9
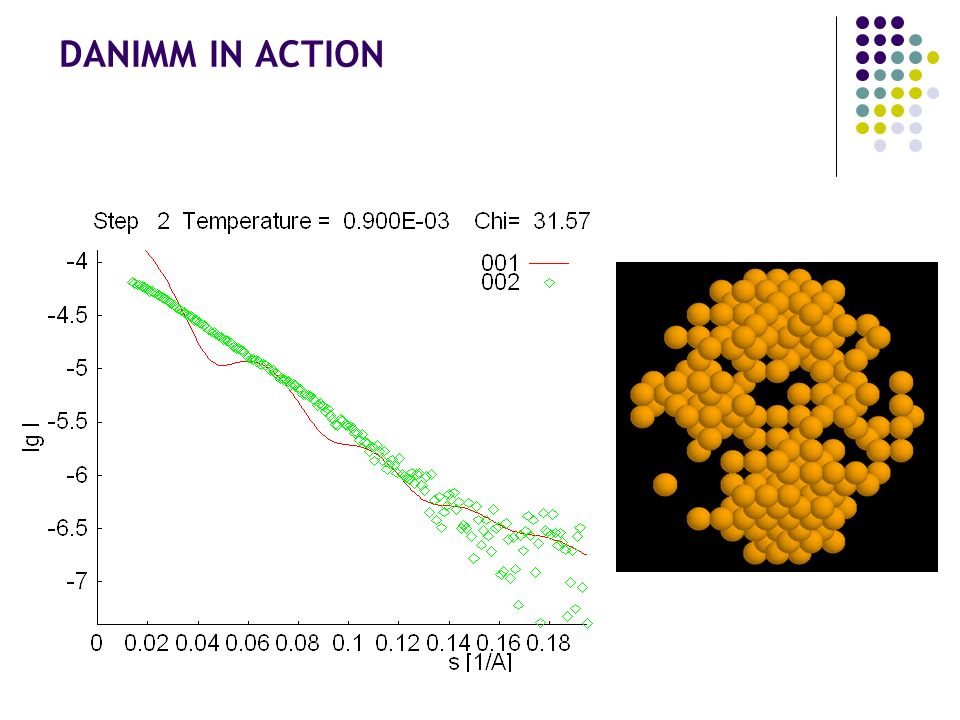
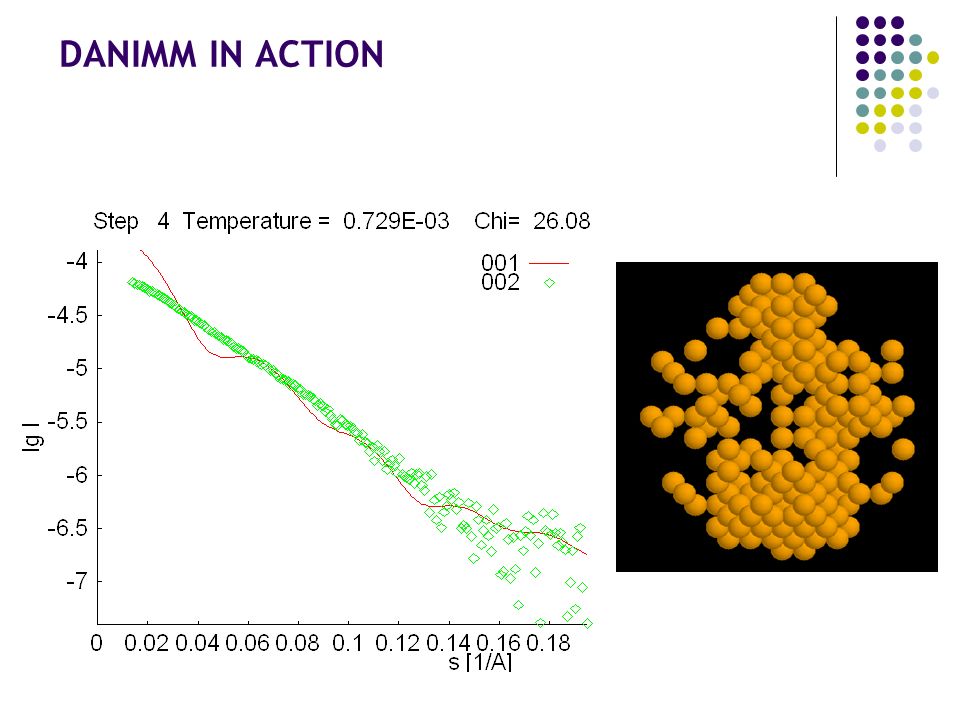
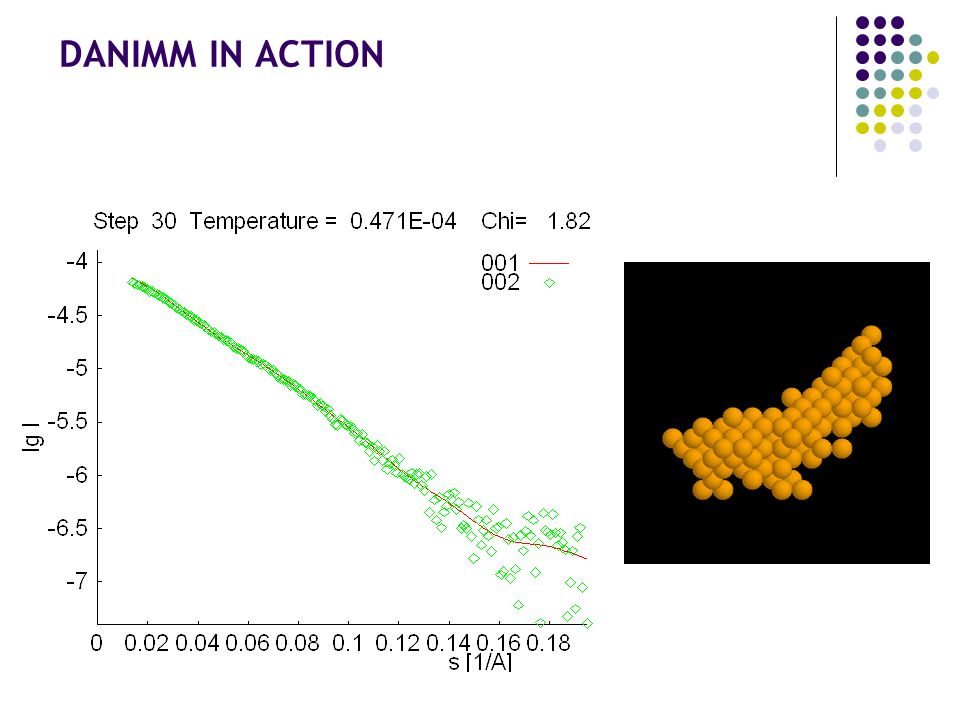
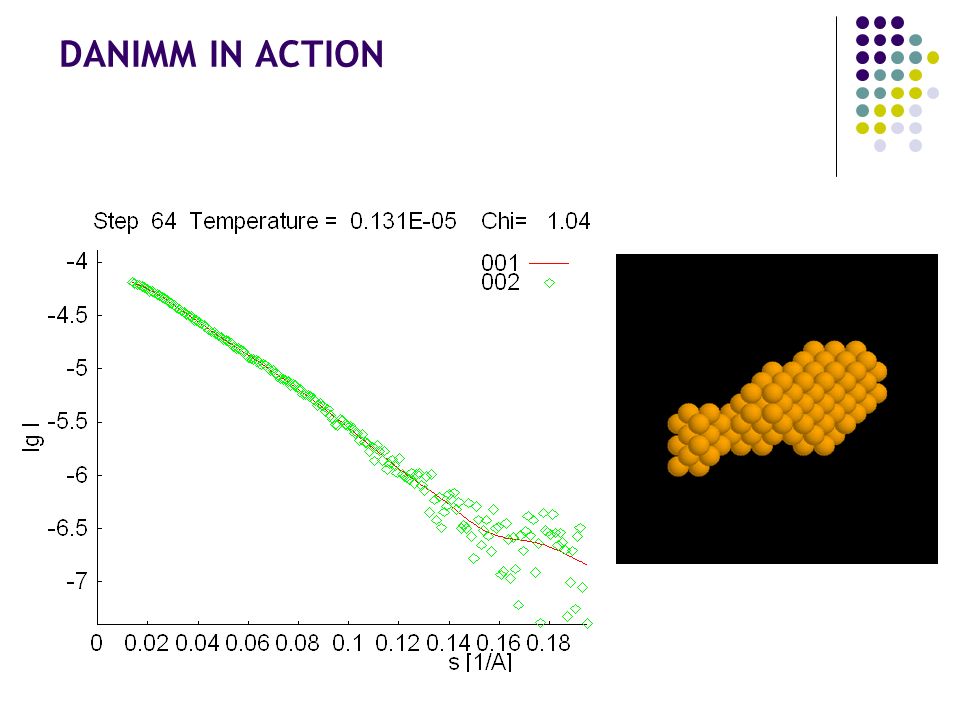
DANIMM is a tool for creating 3-D molecular models from SANS experimental data It uses a brute force numerical method in order to create a viable model that fits to the experimental curve The algorithm starts from a compact molecule of close diameter to the studied probe (or a very large parameter for unknown probes) Using a combination of Monte Carlo and simulated annealing, it removes particles from the molecule and calculates the scattering diagram of the new molecule It then tries to fit, as closely as possible, the calculated diagram to the experimental one until it obtains a suitable match The following slides present DANIMM in action DANIMM was created at EMBL in HAMBURG and the following images are taken from their public archives at http://www.embl-hamburg.de/ExternalInfo/Research/Sax/index.html DANIMM 3D MODELING TOOL
 Using a combination of Monte Carlo and simulated annealing, it removes particles from the molecule and calculates the scattering diagram of the new molecule It then tries to fit, as closely as possible, the calculated diagram to the experimental one until it obtains a suitable match The following slides present DANIMM in action DANIMM was created at EMBL in HAMBURG and the following images are taken from their public archives at DANIMM 3D MODELING TOOL")
10
DANIMM IN ACTION

15
FERROFLUIDS Ferrofluids where first researched at NASA. During the space programme of the early 1960’s, the problem arose of how to control the flow of liquid fuel in a zero gravity environment. The solution offered by NASA’s scientists was a new class of materials known as FERROFLUIDS. The first confirmed application of a ferrofluid was during the APOLLO moon landing projects where the astronaut helmets where sealed using a magnetofluid. APOLLO rocket during takeoff Ferrofluids in action

16
In order to ensure stability in a ferrofluid, a good quality coating needs to be applied to the magnetic particles. These coating particles are known as a surfactant. Above we can see the interaction between two particles coated with a surfactant, and two forms of coating: one with surfactants of the same orientation and the second with opposing directions. If a surfactant is not applied, the interaction between the magnetic particles can lead to the destabilisation of the magnetic fluid, as can be seen in the left picture. FERROFLUID STABILITY PROBLEM M.Balasoiu, Magnetic fluids structure and properties

17
SANS is a powerful method for condensed matter investigation for objects of sizes between 1 nm to 100 nm – therefore it can be considered a nanoscale procedure The IBR – 2 reactor at the JINR is adequate for SANS machine The main parameters and main parts of the YuMO spectrometer have been studied Several applications for SANS exist in the fields of Biology, Chemistry, Polymers, Ferrofluids, etc. A very good method for analysis of density in samples containing more than one compound is the contrast variation method Good programs exist with good mathematical backgrounds for the reconstruction of the shape of a molecule using data collected from sans experiments It was shown how such a shape can be obtained CONCLUSIONS

18
The authors would like to acknowledge the following: Kuklin Aleksandr Balasoiu Maria Kovalev Yurii Murugova Tat’yana All of the above from the Frank Laboratory of Neutron Physics. We would also like to extend our regards to the organizer of the Summer Student Practice and all members of the JINR involved with this project. AKNOWLEDGEMENTS

19
“If you take thinks too seriously, you’re gonna grow old very fast.” - Richard Feynman OUR MAIN DISTRACTION

Similar presentations


, Dr. Seweryn Kowalski (Mentor) Summer REU 2005 – TAMU Cyclotron Institute Reconstruction Main.>")


. Overview Elemental microanalysis Mass spectroscopy Infra-red spectroscopy NMR spectroscopy X-ray crystallography.>")
 by Samuel Ghebru.>")
 Tjatji Tjebane, Dolly Langa, Lolan Naicker, Daphney Singo Joint.>")


