Download presentation
Presentation is loading. Please wait.

1
Qualitative and Limited Dependent Variable Models ECON 6002 Econometrics Memorial University of Newfoundland Adapted from Vera Tabakova’s notes

2
16.1 Models with Binary Dependent Variables 16.2 The Logit Model for Binary Choice 16.3 Multinomial Logit 16.4 Conditional Logit 16.5 Ordered Choice Models 16.6 Models for Count Data 16.7 Limited Dependent Variables

3
Examples of multinomial choice (polytomous) situations: 1. Choice of a laundry detergent: Tide, Cheer, Arm & Hammer, Wisk, etc. 2. Choice of a major: economics, marketing, management, finance or accounting. 3. Choices after graduating from high school: not going to college, going to a private 4-year college, a public 4 year-college, or a 2-year college.

4
The explanatory variable x i is individual specific, but does not change across alternatives. Example age of the individual. The dependent variable is nominal

5
Examples of multinomial choice situations: 1. It is key that there are more than 2 choices 2. It is key that there is no meaningful ordering to them. Otherwise we would want to use that information (with an ordered probit or ordered logit)
.")
6
In essence this model is like a set of simultaneous individual binomial logistic regressions With appropriate weighting, since the different comparisons between different pairs of categories would generally involve different numbers of observations

10
An interesting feature of the odds ratio (16.21) is that the odds of choosing alternative j rather than alternative 1 does not depend on how many alternatives there are in total. There is the implicit assumption in logit models that the odds between any pair of alternatives is independent of irrelevant alternatives (IIA).
..")
11
There is the implicit assumption in logit models that the odds between any pair of alternatives is independent of irrelevant alternatives (IIA) One way to state the assumption If choice A is preferred to choice B out of the choice set {A,B}, then introducing a third alternative X, thus expanding that choice set to {A,B,X}, must not make B preferable to A. which kind of makes sense IIA assumption

12
There is the implicit assumption in logit models that the odds between any pair of alternatives is independent of irrelevant alternatives (IIA) In the case of the multinomial logit model, the IIA implies that adding another alternative or changing the characteristics of a third alternative must not affect the relative odds between the two alternatives considered. This is not realistic for many real life applications involving similar (substitute) alternatives. IIA assumption
 alternatives. IIA assumption.")
13
This is not realistic for many real life applications with similar (substitute) alternatives Examples: Beethoven/Debussy versus another of Beethoven’s Symphonies (Debreu 1960; Tversky 1972) Bicycle/Pony (Luce and Suppes 1965) Red Bus/Blue Bus (McFadden 1974). Black slacks, jeans, shorts versus blue slacks (Hoffman, 2004) Etc. IIA assumption
 Etc. IIA assumption.")
14
This is not realistic for many real life applications with similar (substitute) alternatives Examples: Beethoven/Debussy (Debreu 1960; Tversky 1972) Bicycle/Pony (Luce and Suppes 1965) Red Bus/Blue Bus (McFadden 1974). Black slacks, blue slacks, jeans, shorts (Hoffman, 2004) Etc. IIA assumption
 Etc. IIA assumption.")
15
Red Bus/Blue Bus (McFadden 1974). Imagine commuters first face a decision between two modes of transportation: car and red bus Suppose that a consumer chooses between these two options with equal probability, 0.5, so that the odds ratio equals 1. Now add a third mode, blue bus. Assuming bus commuters do not care about the color of the bus (they are perfect substitutes), consumers are expected to choose between bus and car still with equal probability, so the probability of car is still 0.5, while the probabilities of each of the two bus types should go down to 0.25 However, this violates IIA: for the odds ratio between car and red bus to be preserved, the new probabilities must be: car 0.33; red bus 0.33; blue bus 0.33 Te IIA axiom does not mix well with perfect substitutes IIA assumption
, consumers are expected to choose between bus and car still with equal probability, so the probability of car is still 0.5, while the probabilities of each of the two bus types should go down to 0.25 However, this violates IIA: for the odds ratio between car and red bus to be preserved, the new probabilities must be: car 0.33; red bus 0.33; blue bus 0.33 Te IIA axiom does not mix well with perfect substitutes IIA assumption.")
16
We can test this assumption with a Hausman-McFadden test which compares a logistic model with all the choices with one with restricted choices ( mlogtest, hausman base in STATA, but check option detail too: mlogtest, hausman detail ) However, see Cheng and Long (2007)Cheng and Long (2007) Another test is Small and Hsiao’s (1985) STATA’s command is mlogtest, smhsiao (careful: the sample is randomly split every time, so you must set the seed if you want to replicate your results) See Long and Freese’s book for details and worked examples IIA assumption
 However, see Cheng and Long (2007)Cheng and Long (2007) Another test is Small and Hsiao’s (1985) STATA’s command is mlogtest, smhsiao (careful: the sample is randomly split every time, so you must set the seed if you want to replicate your results) See Long and Freese’s book for details and worked examples IIA assumption")
17
use nels_small, clear average grade on 13 point scale with 1 = highest

18
IIA assumption

19
The randomness…

20
Extensions have arisen to deal with this issue The multinomial probit and the mixed logit are alternative models for nominal outcomes that relax IIA, by allowing correlation among the errors (to reflect similarity among options) but these models often have issues and assumptions themselves IIA can also be relaxed by specifying a hierarchical model, ranking the choice alternatives. The most popular of these is called the McFadden’s nested logit model, which allows correlation among some errors, but not all (e.g. Heiss 2002)e.g. Heiss 2002 Generalized extreme value and multinomial probit models possess another property, the Invariant Proportion of Substitution (Steenburgh 2008), which itself also suggests similarly counterintuitive real-life individual choice behavior Invariant Proportion of Substitution The multinomial probit has serious computational disadvantages too, since it involves calculating multiple (one less than the number of categories) integrals. With integration by simulation this problem is being ameliorated now… IIA assumption
e.g. Heiss 2002 Generalized extreme value and multinomial probit models possess another property, the Invariant Proportion of Substitution (Steenburgh 2008), which itself also suggests similarly counterintuitive real-life individual choice behavior Invariant Proportion of Substitution The multinomial probit has serious computational disadvantages too, since it involves calculating multiple (one less than the number of categories) integrals. With integration by simulation this problem is being ameliorated now… IIA assumption.")
22
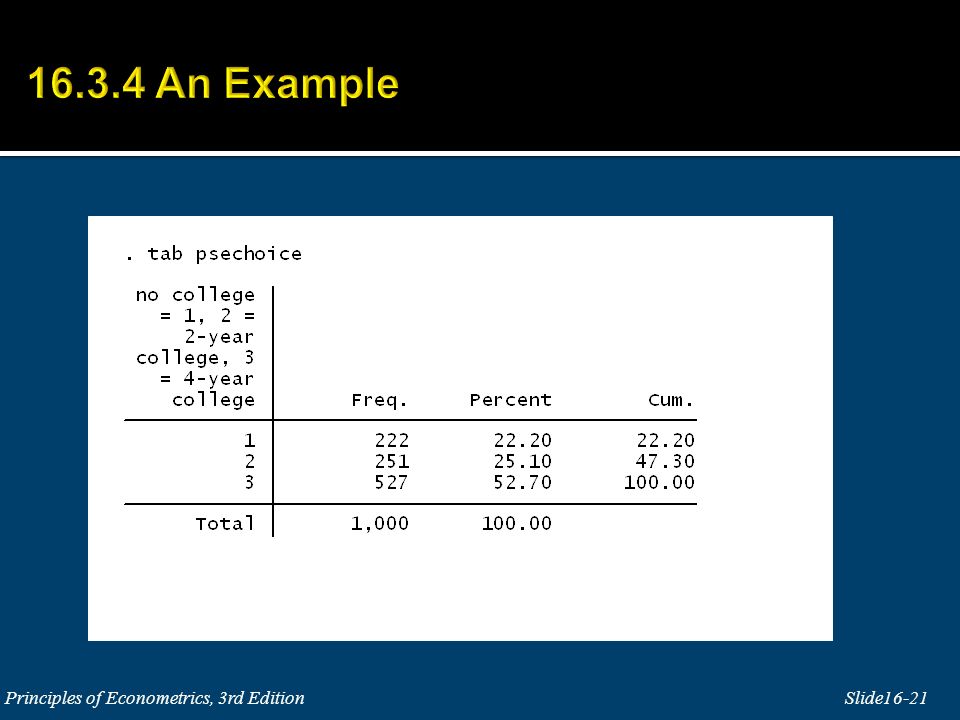
mlogit psechoice grades, baseoutcome(1)
")
23
. tab psechoice, gen(coll) So we can run the individual logits by hand…here “3-year college” versus “no college”
 So we can run the individual logits by hand…here 3-year college versus no college")
24
. tab psechoice, gen(coll) So we can run the individual logits by hand…here “4 year college” versus “no college” Coefficients should look familiar… But check sample sizes!
 So we can run the individual logits by hand…here 4 year college versus no college Coefficients should look familiar… But check sample sizes!")
27
* compute predictions and summarize predict ProbNo ProbCC ProbColl summarize ProbNo ProbCC ProbColl This must always Happen, so do not Use sample values To assess predictive accuracy!

28
Compute marginal effects, say for outcome 1 (no college) If not specified, calculation is done at means
 If not specified, calculation is done at means")
29
Compute marginal effects, say for outcome 1 (no college) If specified, calculation is done at chosen level
 If specified, calculation is done at chosen level")
30
Example Another annotated example http://www.ats.ucla.edu/stat/Stata/output/stata_mlogit_output.htm http://www.ats.ucla.edu/stat/Stata/output/stata_mlogit_output.htm This example showcases also the use of the option rrr which yields the interpretation of the multinomial logistic regression in terms of relative risk ratios In general, the relative risk is a ratio of the probability of an event in the exposed group versus a non-exposed group. Used often in epidemiologyratioprobability

31
Example In STATA mlogit Note that you should specify the base category or STATA will choose the most frequent one It is interesting to experiment with changing the base category Or use listcoef to get more results automatically

32
Combining Categories Consider testing whether two categories could be combined If none of the independent variables really explain the odds of choosing choice A versus B, you should merge them In STATA mlogtest, combine (Wald test) Or mlogtest, lrcomb (LR test)
 Or mlogtest, lrcomb (LR test)")
33
Our example… mlogit psechoice grades faminc, baseoutcome(3) Where does this come from?
 Where does this come from")
34
Our example… mlogit psechoice grades faminc, baseoutcome(3) We test whether all the Coefficients are null When comparing category 1 to the base, Which is 3 here
 We test whether all the Coefficients are null When comparing category 1 to the base, Which is 3 here")
35
Our example… mlogit psechoice grades faminc, baseoutcome(3) These tests are based on comparing unrestricted versus constrained Regressions, where only the intercept is nonzero for the relevant category
 These tests are based on comparing unrestricted versus constrained Regressions, where only the intercept is nonzero for the relevant category")
36
Our example… mlogit psechoice grades faminc, baseoutcome(3) nolog est store unrestricted constraint define 27 [1] mlogit psechoice grades faminc, baseoutcome(3) constraint(27) nolog est store restricted lrtest restricted unrestricted Yields: These tests are based on comparing unrestricted versus constrained Regressions, where only the intercept is nonzero for the relevant category:
![Our example… mlogit psechoice grades faminc, baseoutcome(3) nolog est store unrestricted constraint define 27 [1] mlogit psechoice grades faminc, baseoutcome(3) constraint(27) nolog est store restricted lrtest restricted unrestricted Yields: These tests are based on comparing unrestricted versus constrained Regressions, where only the intercept is nonzero for the relevant category:](http://images.slideplayer.com/26/8290473/slides/slide_36.jpg "Our example… mlogit psechoice grades faminc, baseoutcome(3) nolog est store unrestricted constraint define 27 [1] mlogit psechoice grades faminc, baseoutcome(3) constraint(27) nolog est store restricted lrtest restricted unrestricted Yields: These tests are based on comparing unrestricted versus constrained Regressions, where only the intercept is nonzero for the relevant category:")
37
Multinomial Logit versus Probit Computational issues make the Multinomial Probit very rare LIMDEP seemed to be one of the few software packages that used to include a canned routine for it STATA has now asmprobit Advantage: it does not need IIA

38
Logit as special case of Multinomial Logit

39
Why are the coefficient signs reversed?

40
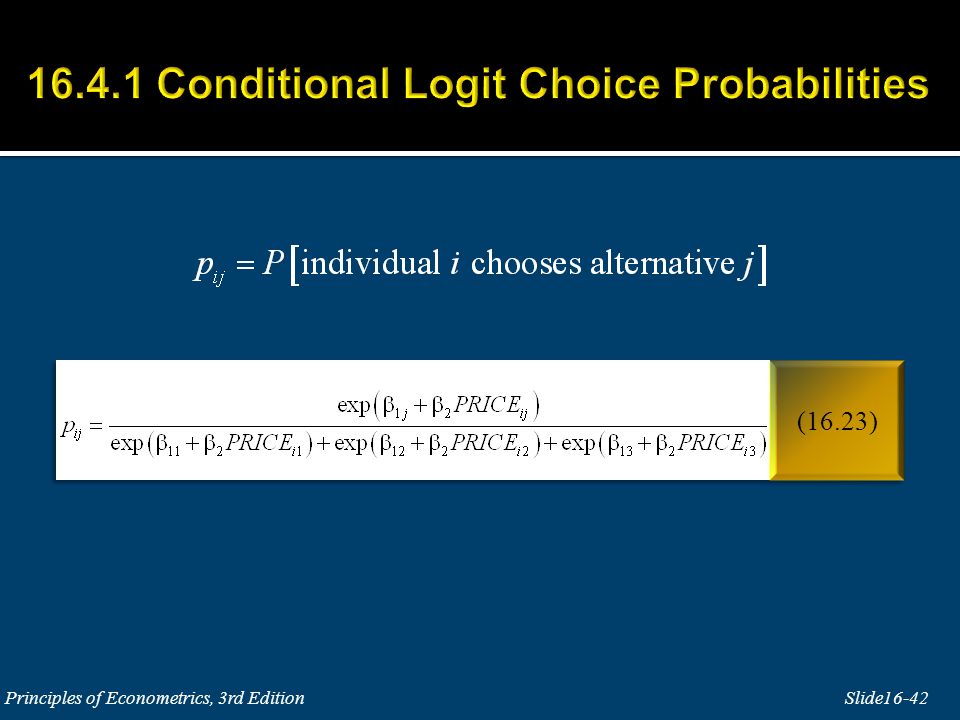
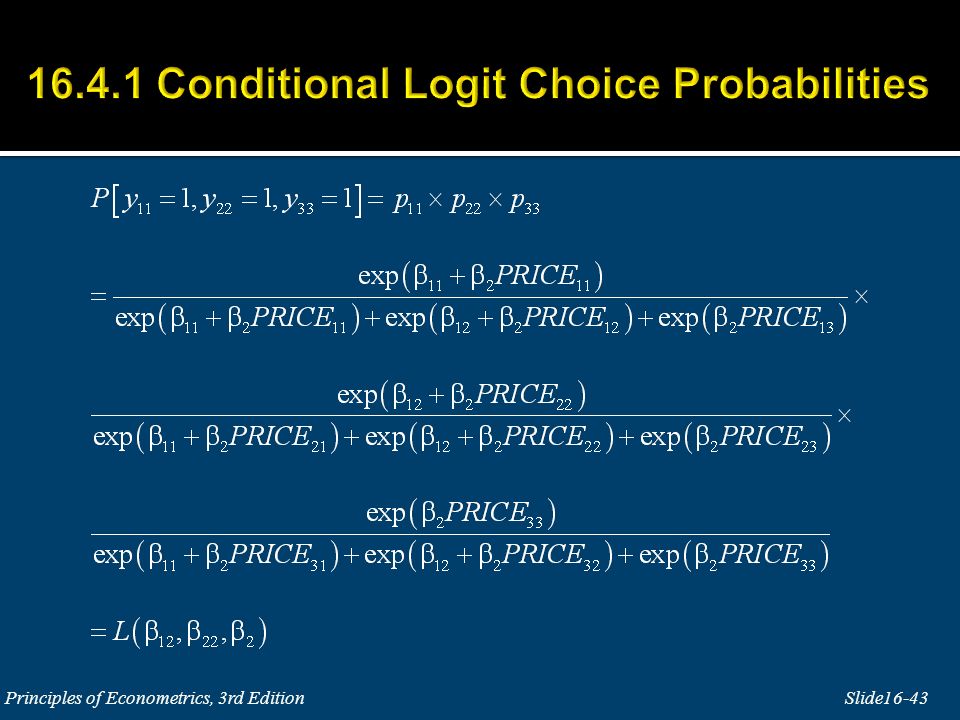
Example: choice between three types (J = 3) of soft drinks, say Pepsi, 7-Up and Coke Classic. Let y i1, y i2 and y i3 be dummy variables that indicate the choice made by individual i. The price facing individual i for brand j is PRICE ij. Variables like price are to be individual and alternative specific, because they vary from individual to individual and are different for each choice the consumer might make

41
Another example: of mode of transportation choice: time from home to work using train, car, or bus.

44
The own price effect is: The cross price effect is:

45
The odds ratio depends on the difference in prices, but not on the prices themselves. As in the multinomial logit model this ratio does not depend on the total number of alternatives, and there is the implicit assumption of the independence of irrelevant alternatives (IIA).
..")
47
The predicted probability of a Pepsi purchase, given that the price of Pepsi is $1, the price of 7-Up is $1.25 and the price of Coke is $1.10 is:

48
use http://www.stata-press.com/data/lf2/travel2.dta, clear

49
An example For this transportation example, the dependent variable is choice, a binary variable indicating which mode of transportation was chosen The regressors include the J − 1 dummy variables train and bus that identify each alternative mode of transportation and the alternative-specific variables time and invc ( invc contains the in-vehicle cost of the trip: we expect that the higher the cost of traveling by some mode, the less likely a person is to choose that mode ) Use the option group(id) to specify that the id variable identifies the groups in the sample
 Use the option group(id) to specify that the id variable identifies the groups in the sample")
50
An example Example from Greene and Hensher (1997) used by Long and Freese too illustrate clogit in STATA: Data on 152 groups (id) of travelers, choosing between three modes of travel: train, bus or car For each group, there are three rows of data corresponding to the three choices faced by each group, so we have N × J = 152 × 3 = 456 observations.
 used by Long and Freese too illustrate clogit in STATA: Data on 152 groups (id) of travelers, choosing between three modes of travel: train, bus or car For each group, there are three rows of data corresponding to the three choices faced by each group, so we have N × J = 152 × 3 = 456 observations.")
51
An example Two dummy variables (a third would be redundant) are used to indicate the mode of travel corresponding to a given row of data train is 1 if the observation has information about taking the train, else train is 0. bus is 1 if the observation contains information about taking a bus, else 0. If both train and bus are 0, the observation has information about driving a car. The actual choice made is shown by the dummy variable choice equal to 1 if the person took the mode of travel corresponding to a specific observation

52
An example Estimates for time and invc are negative: the longer it takes to travel by a given mode, the less likely that mode is to be chosen. Similarly, the more it costs, the less likely a mode is to be chosen

53
An example Odds-ratios Everything else the same in time and invc, people prefer the bus and much prefer the train over the car

54
For the alternative-specific variables, time and invc, the odds ratios are the multiplicative effect of a unit change in a given independent variable on the odds of any given mode of travel E.g.: Increasing travel time by one minute for a given mode of transportation decreases the odds of using that mode of travel by a factor of.98 (2%), holding the values for the other alternatives constant If time for car increases in one minute while the time for train and bus remain the same, the odds of traveling by car decrease by 2 percent
, holding the values for the other alternatives constant If time for car increases in one minute while the time for train and bus remain the same, the odds of traveling by car decrease by 2 percent")
55
The odds ratios for the alternative-specific constants bus and train indicate the relative likelihood of choosing these options versus travelling by car (the base category), assuming that cost and time are the same for all options E.g.: If cost and time were equal, individuals would be 4.36 times more likely to travel by bus than by car, and they would be 14.46 times more likely to travel by train than by car
, assuming that cost and time are the same for all options E.g.: If cost and time were equal, individuals would be 4.36 times more likely to travel by bus than by car, and they would be times more likely to travel by train than by car")
56
CLOGIT data structure Note that the data structure for the analysis of the conditional logit is rather special Long and Freese offer good advice on how to set up data that are structured in a more conventional fashion

57
CLOGIT vs MLOGIT Note that any multinomial logit model can be estimated using clogit by expanding the dataset (see Long and Freese for details) and respecifying the independent variables as a set of interactions This opens up the possibility of mixed models that include both individual-specific and alternative- specific variables This opens up the possibility of imposing constraints on parameters in clogit that are not possible with mlogit (see Hendrickx 2001)see Hendrickx 2001
 and respecifying the independent variables as a set of interactions This opens up the possibility of mixed models that include both individual-specific and alternative- specific variables This opens up the possibility of imposing constraints on parameters in clogit that are not possible with mlogit (see Hendrickx 2001)see Hendrickx 2001")
58
Slide 16-58 Principles of Econometrics, 3rd Edition binary choice models censored data conditional logit count data models feasible generalized least squares Heckit identification problem independence of irrelevant alternatives (IIA) index models individual and alternative specific variables individual specific variables latent variables likelihood function limited dependent variables linear probability model logistic random variable logit log-likelihood function marginal effect maximum likelihood estimation multinomial choice models multinomial logit odds ratio ordered choice models ordered probit ordinal variables Poisson random variable Poisson regression model probit selection bias tobit model truncated data
 index models individual and alternative specific variables individual specific variables latent variables likelihood function limited dependent variables linear probability model logistic random variable logit log-likelihood function marginal effect maximum likelihood estimation multinomial choice models multinomial logit odds ratio ordered choice models ordered probit ordinal variables Poisson random variable Poisson regression model probit selection bias tobit model truncated data")
59
References Long, S. and J. Freese for all topics (available on Google!) Cameron and Trivedi’s book for count data
 Cameron and Trivedi’s book for count data.")
60
Next Ordered Choice Count data

Similar presentations


 Copyright Sawtooth Software, Inc.>")


 = G( 0 + x ) y* = 0 + x + u, y = max(0,y*)>")


