Download presentation
Presentation is loading. Please wait.

1
Testing intraplate deformation in the North American plate interior E. Calais (Purdue Univ.), C. DeMets (U. Wisc.), J.M. Nocquet (Oxford and IGN) ● Is there measurable strain currently accumulating on potentially seismogenic intraplate structures in the stable part of the north American plate (central-eastern US and part of Canada)? ● Use existing continuous GPS stations from the CORS network and from the IGS network. ● Combine independent solutions and derive a consistent velocity field covering the stable interior of the North American plate, with realistic uncertainty estimates. ● Use the resulting velocity field to define a Stable North American Frame to map residual velocities. ● Statistically analyze pattern and magnitude of residual velocities (strain rate).
, C. DeMets (U. Wisc.), J.M. Nocquet (Oxford and IGN) ● Is there measurable strain currently accumulating on potentially seismogenic intraplate structures in the stable part of the north American plate (central-eastern US and part of Canada). ● Use existing continuous GPS stations from the CORS network and from the IGS network. ● Combine independent solutions and derive a consistent velocity field covering the stable interior of the North American plate, with realistic uncertainty estimates. ● Use the resulting velocity field to define a Stable North American Frame to map residual velocities. ● Statistically analyze pattern and magnitude of residual velocities (strain rate)..")
2
● Processed from January 1, 1996 to November 3, 2003: – Gamit @ Purdue, using 11 subnetwork sharing 6 common IGS stations. – Gipsy @ U. Wisc., using point-positioning strategy – New Madrid data recently included – Total of ~290 sites – Monumentation quality and geological setting usually not to “geophysical standards” – Relatively large number of “2- year sites”

4
Altamimi, Z., P. Sillard, and C. Boucher, ITRF2000 : A New Release of the International Terrestrial Reference Frame for Earth Science Applications, J. Geophys. Res., 10.1029, 2002.

5
Variance scaling factor and WRMS of individual solutions in the combination. The WRMS reflects the level of agreement of individual solutions in the combination: Why combine independent solutions? – It minimizes systematic errors associated with each individual processing strategy. – Sites shared by several solutions provide a way to tie them into a single and consistent velocity field. – Sites common to several solutions serve to cross-check the solutions and detect outliers.

6
# of sites in estimation Chi^2 ● NOAM/ITRF Euler poles from various authors + 1-sigma error ellipse. ● Note the offset between poles in ITRF96 (Dixon, Larson), ITRF97 (Sella 2002, Gan and Prescott), and ITRF2000. ● NOAM/ITRF2000 poles are clustered close to each other. Poles from Sella (new results), Altamimi (labeled ITRF2000) Marquez and DeMets, and this study are similar at the 1- sigma level. ● The series of red stars labeled “this study” show Euler poles for various subset of sites on stable North America. Note that they are all within 1-sigma of each other and of estimates by M&D, Altamimi, and Sella. ● The choice of stations used to define the rigid North American plate has little influence on its rotation parameters and on site velocity estimates in the western US (less than 0.1 mm/yr).
, ITRF97 (Sella 2002, Gan and Prescott), and ITRF2000. ● NOAM/ITRF2000 poles are clustered close to each other. Poles from Sella (new results), Altamimi (labeled ITRF2000) Marquez and DeMets, and this study are similar at the 1- sigma level. ● The series of red stars labeled this study show Euler poles for various subset of sites on stable North America. Note that they are all within 1-sigma of each other and of estimates by M&D, Altamimi, and Sella. ● The choice of stations used to define the rigid North American plate has little influence on its rotation parameters and on site velocity estimates in the western US (less than 0.1 mm/yr)..")
7
● Error ellipses are 95% confidence and include the variance of the NOAM/ITRF rotation parameters. ● Shown here: all sites with 1- sigma velocity uncertainty less than 2 mm/yr and horizontal velocity less than 20 mm/yr. ● Note obvious outliers with large velocities. ● Average residual velocity = 0.2+-0.9 mm/yr (1-sigma) for all GPS sites in the central and eastern US (this number does not change significantly if outliers are removed)
 for all GPS sites in the central and eastern US (this number does not change significantly if outliers are removed).")
8
● Error ellipses are 95% confidence and include the variance of the NOAM/ITRF rotation parameters. ● Shown here: all sites with 1- sigma velocity uncertainty less than 2 mm/yr and horizontal velocity less than 5 mm/yr. ● The pattern looks random. Note sites with residual velocity > 2 mm/yr, some of them with small uncertainty.

9
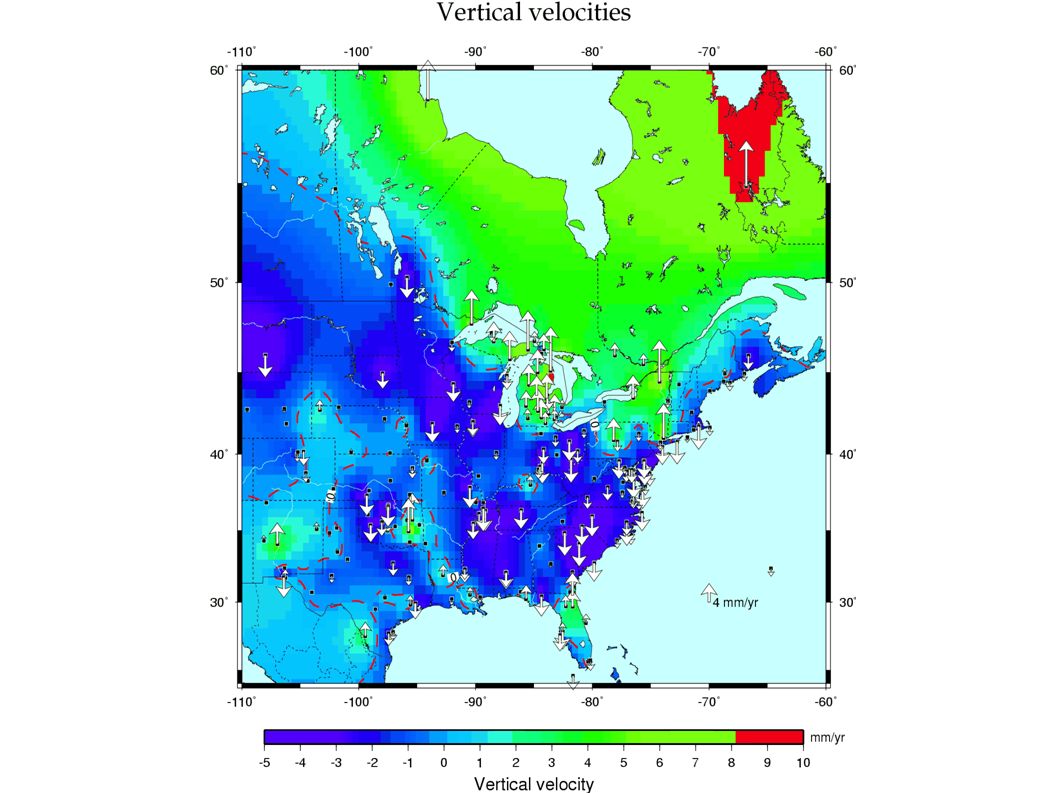
● Error ellipses are 95% confidence and include the variance of the NOAM/ITRF rotation parameters. ● Shown here: all sites with 1- sigma velocity uncertainty less than 2 mm/yr and horizontal velocity less than 2 mm/yr. ● Random pattern, except for the NE part of the US: systematically pointing south (Michigan) to southeast (Ohio) to east (east coast): GIA? ● None of the velocities are significant at the 95% confidence level.
 to southeast (Ohio) to east (east coast): GIA. ● None of the velocities are significant at the 95% confidence level..")
10
● Error ellipses are 1-sigma and include the variance of the NOAM/ITRF rotation parameters. ● Shown here: all sites with 1- sigma velocity uncertainty less than 2 mm/yr and horizontal velocity less than 2 mm/yr. ● Same conclusions are previous slide.

11
● Error ellipses not shown. ● Shown here: all sites with 1- sigma velocity uncertainty less than 2 mm/yr and horizontal velocity less than 2 mm/yr. ● Same conclusions are previous slides. There seem to be a non- random pattern in the NE US.

13
Impact on velocity at JPLM in NOAM frame (mm/yr): ● Red: “PGR” velocity field ● “PGR” velocities are added to velocities in ITRF2000 ● Estimation of NOAM angular velocity ● Blue: residual velocities
: ● Red: PGR velocity field ● PGR velocities are added to velocities in ITRF2000 ● Estimation of NOAM angular velocity ● Blue: residual velocities")
15
Conclusions ● Next steps: – Combine with additional solutions – Investigate relationship between monuments/geology and residual velocities – Statistical analysis of residual velocities --> random pattern? ● Combining independent solutions minimizes systematic errors ● Cleaning and site selection are important ● Bring PGR into the frame definition? ● Do we need a time-dependent frame? ● Users? --> “RF for dummies” workshp

Similar presentations


 Scripps Orbit.>")


 Working Group Mike Craymer Geodetic Survey Division, Natural Resources Canada 2nd SNARF Workshop Montreal, May.>")
 Chair: Geoff Blewitt.>")


