Download presentation
Presentation is loading. Please wait.

1
Geography 520: CLIMATOLOGY

2
Review of last lecture The modern climatology (meteorology) was born in the 1940s (a very young science!), but has been growing very fast! Now we have a global observational network with many satellites, ships, radars and surface stations, as well as very comprehensive prediction models running on the world’s largest computers. The current status of weather and climate predictions: (1) weather prediction good to 10 days, (2) tropical cyclone prediction good in track but not in intensity, (3) climate prediction good to two seasons, (4) climate change projections have a 3-fold difference in magnitude. The main reasons of the difficulties: (1) Teleconnection problem, (2) Feedback problem, and (3) Subgrid-scale problem.
 weather prediction good to 10 days, (2) tropical cyclone prediction good in track but not in intensity, (3) climate prediction good to two seasons, (4) climate change projections have a 3-fold difference in magnitude. The main reasons of the difficulties: (1) Teleconnection problem, (2) Feedback problem, and (3) Subgrid-scale problem..")
3
Some basic concepts Units of measurement Scientific notation Time

4
Standard units of measurement SI (System International) QuantityNameUnitsSymbol Lengthmetermm Masskilogramkgkg Timesecondss TemperatureKelvinKK Densitykilogramkg/m 3 kg/m 3 per cubic meter Speedmeter perm/sm/s second Forcenewtonm.kg/s 2 N PressurepascalN/m 2 Pa EnergyjouleN.mJ PowerwattJ/sW
 QuantityNameUnitsSymbol Lengthmetermm Masskilogramkgkg Timesecondss TemperatureKelvinKK Densitykilogramkg/m 3 kg/m 3 per cubic meter Speedmeter perm/sm/s second Forcenewtonm.kg/s 2 N PressurepascalN/m 2 Pa EnergyjouleN.mJ PowerwattJ/sW")
5
Scientific Notation nanoone-billionth10 -9 0.000000001 microone-millionth10 -6 0.000001 millione-thousandth10 -3 0.001 centione-hundredth10 -2 0.01 decione-tenth10 -1 0.1 dekaten10 1 10 hectoone hundred10 2 100 kiloone thousand10 3 1000 megaone million10 6 1000000 gigaone billion10 9 1000000000 … yotta10 24

6
Universal Coordinated Time (UTC) 24 hour clock to standardize all time. Measured on the prime meridian through Greenwich, UK; Greenwich Mean Time (GMT). UTC does not change with daylight savings. Subtract 5 hours from UTC to get Eastern Standard Time (EST); 4 hrs for daylight (EDT) Add 5 hours to go from EST to UTC. How do we go from Pacific Standard Time to UTC?
. UTC does not change with daylight savings. Subtract 5 hours from UTC to get Eastern Standard Time (EST); 4 hrs for daylight (EDT) Add 5 hours to go from EST to UTC. How do we go from Pacific Standard Time to UTC .")
7
Chapter 1: Composition and Structure of the Atmosphere

8
The basic variables describing the atmosphere a) air temperature b) air pressure c) humidity d) wind e) clouds f) precipitation
 air temperature b) air pressure c) humidity d) wind e) clouds f) precipitation")
9
Atmospheric Thickness No defined top to the atmosphere The atmosphere is very shallow—and is less than 2% of the Earth’s thickness Over 90% of atmosphere in the lowest 16km & is where nearly all weather occurs

10
Atmospheric Composition Composed of –Gases Permanent: form a constant proportion of the atmospheric mass (stable concentration) Variable: distribution varies in both time and space –Aerosols Permanent gases = 99.999% of atmospheric mass, and are well mixed (homogenous) in the lowest 80km. This is called the homosphere, which is nearly the entire atmosphere Heterosphere: highest portions of atmosphere where the light gases are abundant and composition varies considerably with altitude

11
The Permanent Gases

12
The Variable Gases Also methane, but in very small proportions

13
Water Vapor Most abundant variable gas Majority of water vapor is found in lowest 5km of atmos (comes from sfc evaporation) Effective greenhouse gas…is it changing? Hydrologic cycle is the process of water being cycled from the planet to the atmosphere and back again

14
Water vapor detected from space

15
Carbon Dioxide ~0.037% (370 ppm) of total atmosphere, yet very important gas - the major greenhouse gas Supplied to atmosphere by –Respiration processes –Decay of organic material –Volcanic eruptions –Combustion Removed by photosynthesis: converting light energy to chemical energy
 of total atmosphere, yet very important gas - the major greenhouse gas Supplied to atmosphere by –Respiration processes –Decay of organic material –Volcanic eruptions –Combustion Removed by photosynthesis: converting light energy to chemical energy")
16
CO 2 on the rise CO2 record from Mauna Loa, Hawaii Distinct seasonal cycle IPCC (2001) (A Longer Perspective) Since the 1950s, CO 2 has increased at the rate of about 1.8 ppm yr -1
 (A Longer Perspective) Since the 1950s, CO 2 has increased at the rate of about 1.8 ppm yr -1")
17
Ozone Form of oxygen in which three atoms are bonded together (O 3 ) Absorbs harmful ultraviolet (uv) radiation in upper atmosphere Release of CFC’s led to depletion of ozone, especially over the Antarctic 66% increase in skin cancer between 1987 and 2001 in Punta Arenas, Chile, the southernmost city in the world (Abarca and Casiccia 2002) Near surface it is a major pollutant Greatest density in stratosphere
 Absorbs harmful ultraviolet (uv) radiation in upper atmosphere Release of CFC’s led to depletion of ozone, especially over the Antarctic 66% increase in skin cancer between 1987 and 2001 in Punta Arenas, Chile, the southernmost city in the world (Abarca and Casiccia 2002) Near surface it is a major pollutant Greatest density in stratosphere")
18
How does ozone loss occur From photodissociation of chlorofluorocarbon (CFC) compounds, commonly called freons photodissociation chlorofluorocarbonfreons
 compounds, commonly called freons photodissociation chlorofluorocarbonfreons")
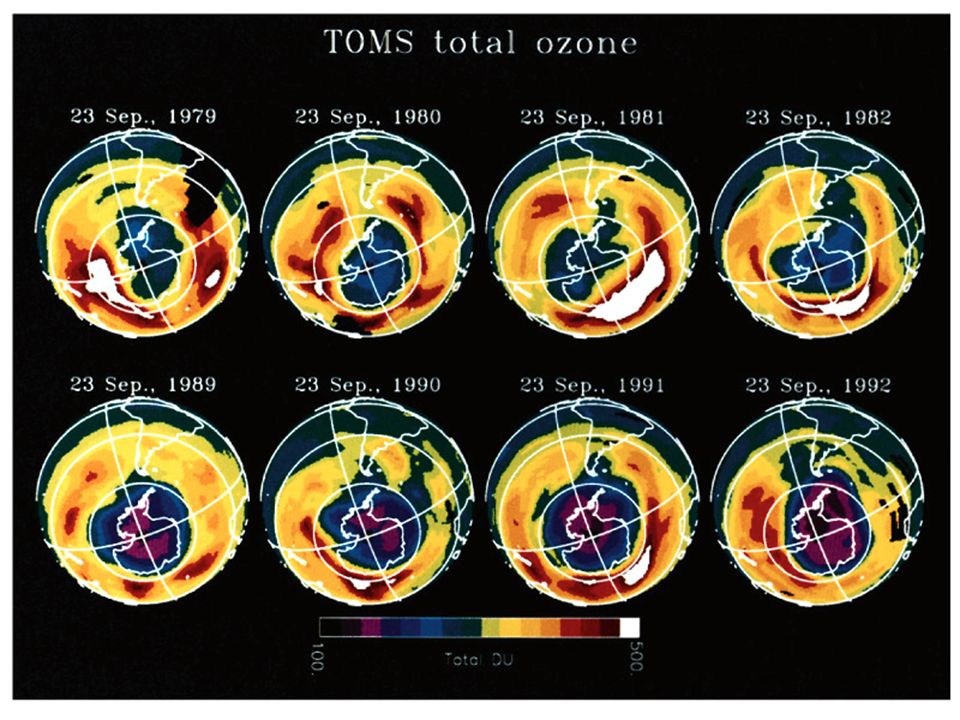
20
Ozone Trends in Polar Regions

21
Methane Increased over the last few decades, but still very small concentrations in atmos Effective absorber of thermal radiation emitted from Earth, therefore helps in warming of the atmosphere IPCC (2001)
")
22
Aerosols Small solid particles and liquid droplets Very small (0.1 micrometer) Suspended in air Lower visibility Both natural (sea spray, dust, volcanic) and human (pollution) products Condensation nuclei: suspended aerosols in which water vapor condenses on to form cloud droplets IPCC (2001) Sulfate aerosols in Greenland ice (IPCC 2001)
 Suspended in air Lower visibility Both natural (sea spray, dust, volcanic) and human (pollution) products Condensation nuclei: suspended aerosols in which water vapor condenses on to form cloud droplets IPCC (2001) Sulfate aerosols in Greenland ice (IPCC 2001)")
23
Residence Time The amount of time a gas is in the atmosphere The permanent gases have long residence times (N 2 =42,000,000 y, O 2 =5,000 y) The variable gases generally have shorter residence times (H 2 0=10 days, CO 2 =150 y) This is an important concept from a climate change standpoint…the residence time of CO 2 is still hotly debated - this affects the decisions of policy makers on how to regulate fossil fuel emissions
 The variable gases generally have shorter residence times (H 2 0=10 days, CO 2 =150 y) This is an important concept from a climate change standpoint…the residence time of CO 2 is still hotly debated - this affects the decisions of policy makers on how to regulate fossil fuel emissions")
24
Vertical Structure Gravity holds atmosphere close to surface Atmosphere is more dense at surface (density = mass / volume) Greater density = shorter mean free paths
 Greater density = shorter mean free paths")
25
Temperature Layers

26
Troposphere Depth varies based largely on temp. –Thinnest layer –Thickest at equator Temperature decreases with height (heat source is from sfc, farther you are from sfc, colder it is) Nearly all weather occurs here, planes fly here, all mountain peaks are in troposphere Contains 80% of the atmospheric mass Ends at the tropopause, where temperatures are fairly constant with height
 Nearly all weather occurs here, planes fly here, all mountain peaks are in troposphere Contains 80% of the atmospheric mass Ends at the tropopause, where temperatures are fairly constant with height.")
27
Troposphere Cont’d Most clouds exist in the troposphere. Occasionally, violent updrafts penetrate cloudtops into the stratosphere. The flattened top of this cumulonimbus cloud is in the stratosphere.

28
Stratosphere From 11km-50km roughly Little/no weather Ozone is found in abundance in this region The absorption of UV radiation by ozone leads to temperatures increasing with height in the stratosphere Contains about 19.9 percent of atmos. mass, even though it is 3x deeper than the troposphere Ends at the stratopause

29
Mesosphere and Thermosphere Next highest is mesosphere, temperature quickly decreases with height in this region Thermosphere is outermost layer, where temperatures increase to values in excess of 1500 o C (recall heat is different than temperature) –The thermosphere slowly merges with interplanetary space
 –The thermosphere slowly merges with interplanetary space")
30
Chapter 1 Basic Concepts Be able to answer: –The standard units of measurements (SI) –How thick is the atmosphere compared to the earth’s thickness? –What is residence time? What is the difference between the permanent and variable gases? Name 3 of each. –Given that variable gases are so rare, why are they considered at all? How are CO 2 and O 3 changing?

31
Temperature Layers The names of the 4 layers What separate them? The approximate height of tropopause, stratopause and mesopause

32
For next class Read though Ch. 2. We’ll have our first in-class assignment.

Similar presentations


 was born in the 1940s (a very young science!), but has been growing.>")


