Download presentation
Presentation is loading. Please wait.

1
Metagenomic Analysis Using MEGAN4 Peter R. Hoyt Director, OSU Bioinformatics Graduate Certificate Program Matthew Vaughn iPlant, University of Texas Super Computing Center

2
Introduction In METAGENOMICS, the aim is to understand the composition and operation of complex microbial consortia in environmental samples through sequencing and analysis of their DNA. Similarly, metatranscriptomics and metaproteomics target the RNA and proteins obtained from such samples. Technological advances in next-generation sequencing methods are fueling a rapid increase in the number and scope of environmental sequencing projects. In consequence, there is a dramatic increase in the volume of sequence data to be analyzed. http://ab.inf.uni-tuebingen.de/software/megan/welcome.html

3
The $100 Human Genome The Importance of Metagenomics is Driven by Sequencing Costs

4
Basic Computational Metagenomics The first three basic computational tasks for such data are: taxonomic analysis (“who is out there?”) functional analysis (“what are they doing?”) comparative analysis. (“how do they compare?”) This is an immense conceptual and computational challenge that MEGAN is designed to address. http://ab.inf.uni-tuebingen.de/software/megan/welcome.html
 This is an immense conceptual and computational challenge that MEGAN is designed to address.")
5
http://ab.inf.uni-tuebingen.de/talks/Megan-tutorial2010.pptx.pdf For Example:

6
Taxonomic Metagenomic Metatranscriptomic Metaproteomic 16S rRNA sequences Function/Gene Ontology (SEED) Metabolomics/Pathway Analyses (KEGG) Comparative Genomics http://ab.inf.uni-tuebingen.de/software/megan/welcome.html Algorithms in Bioinformatics MEGAN-4 USES
 Metabolomics/Pathway Analyses (KEGG) Comparative Genomics Algorithms in Bioinformatics MEGAN-4 USES")
7
Prepare a dataset for use with MEGAN: 1. First compare reads against a database of reference sequences, e.g. BLASTX search against the NCBI-NR database. 2. Reads file & resulting BLAST file can be directly imported into MEGAN* Automatic taxonomic classification or functional classification, Uses SEED or KEGG classification, or both. 3. Multiple datasets can be opened simultaneously for comparative views http://ab.inf.uni-tuebingen.de/software/megan/welcome.html Getting started aatacgaacatt tgccatggacgc tggccattgac nr nt Ref seq Ref seq pdb rdb Comparative Data MEGAN4 Metagenomic sample DNA-RNA-Protein Raw Digital Data BLAST

8
MEGAN can be used to interactively explore the dataset. Figure shows assignment of reads to the NCBI taxonomy. Each node is labeled by a taxon and the number of reads assigned to the taxon, The size of a node is scaled logarithmically to represent the number of assigned reads. Tree display options allow you to interactively drill down to the individual BLAST hits and to export all reads One can select a set of taxa and then use MEGAN to generate different types of charts http://ab.inf.uni-tuebingen.de/software/megan/welcome.html Taxonomic analysis

9
Multiple Chart Options are Available

10
MEGAN attempts to map each read to a SEED functional role by the highest scoring BLAST protein match with a known functional role. SEED rooted trees are “multi-labeled” because different leaves may represent the same functional role (if it occurs in different types of subsystems) The current complete SEED tree has about 13,000 nodes. http://ab.inf.uni-tuebingen.de/software/megan/welcome.html Functional analysis using the SEED classification 1 http://www.theseed.org/wiki/Main_Page SEED 1 is a comparative genomics environment of curated genomic data. The following figure shows a part of the SEED analysis of a marine metagenome sample.
 The current complete SEED tree has about 13,000 nodes. Functional analysis using the SEED classification 1 SEED 1 is a comparative genomics environment of curated genomic data. The following figure shows a part of the SEED analysis of a marine metagenome sample..")
11
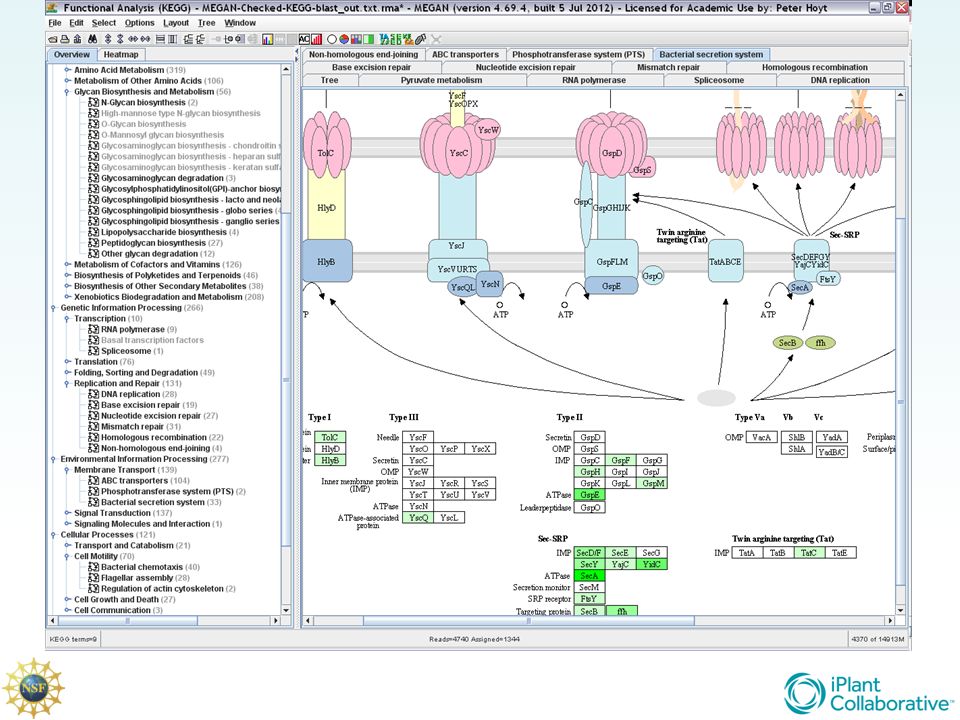
To perform a KEGG analysis, MEGAN attempts to match each read to a KEGG orthology (KO) accession number, using the best hit to a reference sequenceKEGG Reads are then assigned to enzymes and pathways. The KEGG classification is represented by a rooted tree whose leaves represent pathways. Each pathway can also be inspected visually, for example the citric acid cycle (shown) KEGG displays different participating enzymes by numbered rectangles. MEGAN shades each such rectangle is so as to indicate the number of reads assigned to the corresponding enzyme. http://ab.inf.uni-tuebingen.de/software/megan/welcome.html Functional analysis using the KEGG classification
 KEGG displays different participating enzymes by numbered rectangles. MEGAN shades each such rectangle is so as to indicate the number of reads assigned to the corresponding enzyme. Functional analysis using the KEGG classification.")
13
MEGAN also supports the simultaneous analysis and comparison of the SEED functional content of multiple metagenomes, A comparative view of assignments to a KEGG pathway is also possible. http://ab.inf.uni-tuebingen.de/software/megan/welcome.html Comparitive analysis using the SEED classification

14
MEGAN supports a number of different methods for calculating a distance matrix, These can be visualized either using a split network calculated using the neighbor-net algorithm, or using a multi-dimensional scaling plot. The figure we shows a comparison of eight marine datasets based on the taxonomic content of the datasets and computed using Goodall’s index. http://ab.inf.uni-tuebingen.de/software/megan/welcome.html MEGANs analysis window compares multiple datasets. This enables creating distance matrices for a collection of datasets using different ecological indices. Computational comparison of metagenomes

15
MEGAN provides a comparison view that is based on a tree in which each node shows the number of reads assigned to it for each of the datasets. This can be done either as a pie chart, a bar chart or as a heat map. http://ab.inf.uni-tuebingen.de/software/megan/welcome.html Comparative phylogenetic visualization Once the datasets are all individually opened MEGAN provides a “compare” dialog. The following figure shows the taxonomic comparison of all eight marine datasets. Here, each node in the NCBI taxonomy is shown as a bar chart indicating the number of reads (normalized, if desired) from each dataset assigned to the node.
 from each dataset assigned to the node..")
Similar presentations


 The Mechanics of Alignments.>")
 Global Ocean Sampling project (GOS) CAMERA CAMERA METAREP.>")


